

Trends in Waipā River water quality
Water quality in the Waipā River is much better than it was in the 1950s. Urban and industrial wastewater treatment has improved considerably.
Over the past 20 years or more, however, levels of nitrogen in the river have risen, probably as a result of intensification in land use over recent decades.
Pollution of the past
The 1950s impacts of discharges of sewage and industrial wastewater to the river have been addressed. Better treatment technologies led to improvements in water quality.
However, agriculture has continued to intensify in the catchment. The soft mudstone geology of the upper Waipa, prone to landslides and erosion without its forest cover, added large amounts of sediment to the river. The Waipa is the largest tributary to the Waikato River. Its sediment load makes its way into the lower Waikato where the rivers meet at Ngaruwahia.
The road to recovery
Improvements to wastewater treatment
Improvements to wastewater treatment from the 1950s on meant that by the 1990s, contaminant levels of E.coli were 100 times lower.
Recent changes in water quality
Monthly monitoring of water quality in the Waipā River began in 1989. Analysis of this record indicates how water quality has changed.
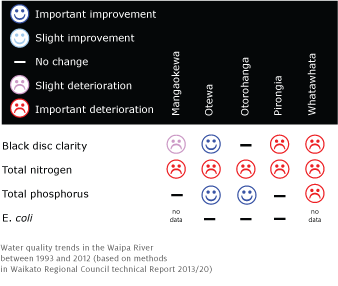
The table below shows the changes in several water quality measures between 1993 and 2012. An important trend to note is the increase in total nitrogen over the last 20 years. As with the Waikato River, land use has intensified and today is the main source of nitrogen to the river.
The records of clarity, E.coli and phosphorus are generally stable – though clarity is poor and levels of E.coli and phosphorus are high. Note, however, that monitoring records start after much of the land in the catchment was developed.
The recent increases in levels of nitrogen are of concern. As the region continues to grow and develop, putting pressure on the river's catchment, careful management is needed to maintain and improve the Waipā River’s quality.
Table 1: Water quality trends in the Waipa River between 1993 and 2012 (based on methods in Waikato Regional Council technical report 2013/20)
Footnote:
‘No change’ means that overall change in average values is likely just to be due to chance (at the 5% level).
Where a trend is identified, any overall change is unlikely to be due to chance (at the 5% level).
A slight trend has a rate of change which is less than 1% of the median value per year.
An important trend has a rate of change which is more than 1% of the median value per year.

To ask for help or report a problem, contact us
Tell us how we can improve the information on this page. (optional)