

Income inequality

 INCOME INEQUALITY
| |
NO SIGNIFICANT CHANGE |
Household income inequality in the Waikato region varies from year to year but there is no apparent long-term trend. The Waikato region generally has slightly less income inequality (more equality) than New Zealand overall.
This indicator uses a ‘Gini coefficient’ to measure income inequality across households in the Waikato region. ‘Zero’ indicates perfect income equality. As the measure gets closer to ‘1’, income inequality increases. The Waikato ‘Gini coefficient’ for 2022 is 0.35.
Why is this indicator important?
Income equality is often regarded as a measure of the fairness of the society in which we live. A high level of income inequality may be detrimental to the level of social connectedness across society and research has suggested a negative relationship between income inequality and other factors with an influence on well-being such as trust, social mobility, health outcomes, and the rate of imprisonment.
A higher average level of income inequality indicates that within that population, a greater proportion of households total income is accruing to a smaller proportion of households. This means most people living in that area are on lower incomes compared to the minority that have a higher income and may have a lower standard of living as a result.
On the other hand, opportunities to earn more money can encourage some people to innovate and contribute to economic growth within an area. As not everyone can do this, people on lower incomes can become concerned over economic growth not being fairly shared between rich and poor.
When people within a population earn similar levels of income, there are likely to be more social connections and less conflict within that community, which also contributes to people’s wellbeing and sustainable development.
In September 2015, New Zealand and many other countries agreed to reduce inequality as part of the Sustainable Development Goals (SDGs) known as Agenda 2030 (SDG Goal # 10).
Income inequality
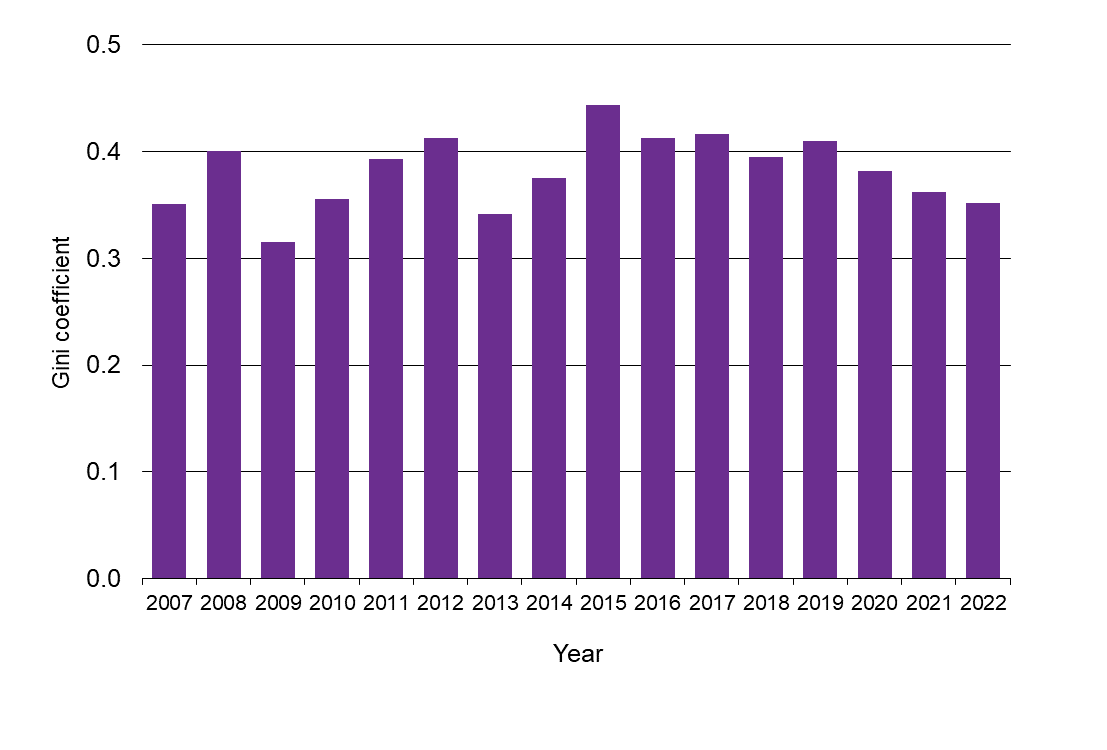
Note: Indicative only due to small sample size. (Refer to ‘Data source and supporting information’).
| Year | Gini coefficient |
| 2007 | 0.351 |
| 2008 | 0.401 |
| 2009 | 0.315 |
| 2010 | 0.355 |
| 2011 | 0.393 |
| 2012 | 0.412 |
| 2013 | 0.342 |
| 2014 | 0.375 |
| 2015 | 0.444 |
| 2016 | 0.413 |
| 2017 | 0.417 |
| 2018 | 0.395 |
| 2019 | 0.410 |
| 2020 | 0.382 |
| 2021 | 0.362 |
| 2022 | 0.352 |
What is this indicator telling us?
- This indicator is inherently variable due to relatively small sub-national sample size and variation in the numbers of very-high-income households in the sample each year. Taking these factors into account, the Waikato regional level of income inequality in 2022 was similar to 2007.
- The household income inequality indicator for the Waikato region was also similar or slightly lower than the New Zealand average for much of the period between 2007 and 2022.
- According to a 2017 Ministry of Social Development report on income inequality and hardship indicator trends for New Zealand overall (Perry 2017, page 87), there was a steep rise in the Gini coefficient and other income inequality indicators from the late 1980s to the early 1990s followed by a relative flatness of the Gini trend line from the mid-1990s. Perry identifies some fluctuations in household income inequality since the mid-1990s but no evidence of any sustained rise or fall in the Gini coefficient or other income inequality indicators over this period (Perry 2017, page 85).
- An alternative measure of income inequality is the P80/P20 ratio. This is calculated as the ratio of household income at the 80th percentile (i.e. 20% below the wealthiest household) to household income at the 20th percentile (i.e. 20% above the lowest income household), after adjusting for household size and composition. As household income inequality increases, so does the P80/P20 ratio. Calculations using data from the New Zealand Household Economic Survey (HES) show that income inequality in the Waikato region using the P80/P20 measure is at similar level to 2007 level and similar to the national average.
- According to the OECD Better Life Index website, New Zealand is ranked 23rd out of 35 OECD countries in relation to its measured level of social inequality.
DATA SOURCE AND SUPPORTING INFORMATION
This indicator is measured using a household income-based Gini coefficient, which indicates the level of inequality or dispersion within a region's income distribution. A Gini coefficient of zero means perfect equality, where every household has exactly the same level of income; whereas a Gini coefficient of one means that only one household is earning all the income (i.e. maximum inequality).
Statistics New Zealand (SNZ) calculated the Gini coefficients for the Waikato region based on data extracted from the Household Economic Survey (HES). The HES provides median annual disposable household income values. Household incomes are reported after tax and government transfers (i.e. disposable household income), and adjusted or equivalised to take into account the number of people within the household.
For these calculations, household equivalisation uses revised Jensen Scale, where equivalisation takes into account age and role in family; after housing costs – expenditure on housing (2009 Stats NZ standard) is deducted from equivalised disposable income; and Gini coefficients program sourced from Statistics New Zealand’s (SNZ). SNZ also provided the P80/P20 ratio for the Waikato region and other selected regions based on data extracted from the HES, but rather than the ratio at the P20 and P80 break points, the ratio was of equivalised median household income within the 2nd decile compared to within the 9th decile.
Note the Gini coefficient takes into account all household incomes and is therefore susceptible to annual variability due to differences in the number of very-high-income households captured in the survey sample each year. Obtaining a consistently representative group of very-high-income households in a survey sample is a well-known difficulty. Therefore, while longer-term trends over several survey periods provides robust and reliable information, smaller changes between survey periods should not be used to support definitive conclusions about change. Similarly, while statistically significant differences between sub-groups (e.g. regions) within one survey year can be counted as providing robust and reliable information, any smaller differences should not be used to support definitive conclusions about differences.
Also note that all HES data from the year ended June 2007 to the year ended June 2016 were revised in early 2014, as household disposable income was previously calculated in a way that tended to overestimate disposable incomes of households on low to middle incomes. These revisions have been incorporated into the WPI time series.
Summary of MSD analysis of New Zealand data comes from Perry, B. (2017) ‘Household incomes in New Zealand: Trends in indicators of inequality and hardship 1982 to 2016’, Ministry of Social Development, Wellington, July 2017: www.msd.govt.nz/documents/about-msd-and-our-work/publications-resources/monitoring/household-income-report/2017/2017-incomes-report-wed-19-july-2017.pdf
Update details: Annual series from SNZ using year-ended-June HES data (released in late November).
Customised data request requirements: A customised data request from SNZ was obtained for this report.
DATA AVAILABILITY – OTHER THAN WAIKATO REGION:
Territorial Authority (TA) disaggregation: No
Other regions: The survey regions are Auckland, Wellington, Rest of North Island, Canterbury and Rest of South Island. Estimates provided by SNZ for the Waikato region are below design level of the survey and therefore indicative only.
New Zealand: Yes
Other countries/ Organisation for Economic Co-operation and Development (OECD): Comparison data from the OECD Income Distribution Database. Also the social inequality index from the OECD Better Life Index website.

To ask for help or report a problem, contact us
Tell us how we can improve the information on this page. (optional)