

Life expectancy

 LIFE EXPECTANCY
| |
IMPROVING TREND |
Life expectancy has been increasing steadily in the Waikato region for several decades.
This indicator is life expectancy at birth for people living in the Waikato region, derived from Statistics New Zealand (SNZ) Life Tables and Census information.
Why is this indicator important?
Life expectancy is a key indicator of the general health of the population. Improvements in life expectancy figures reflect improvements in the region’s social and economic conditions, lifestyle, access to health services and medical advances. Those people in the region who are living longer also potentially have more years to benefit from these related improvements as a result. Measuring life expectancy can also help us to plan for the increased need for support systems and other resources as longer life spans can impact on our region’s population levels and the degree of support older people may need.
Life expectancy
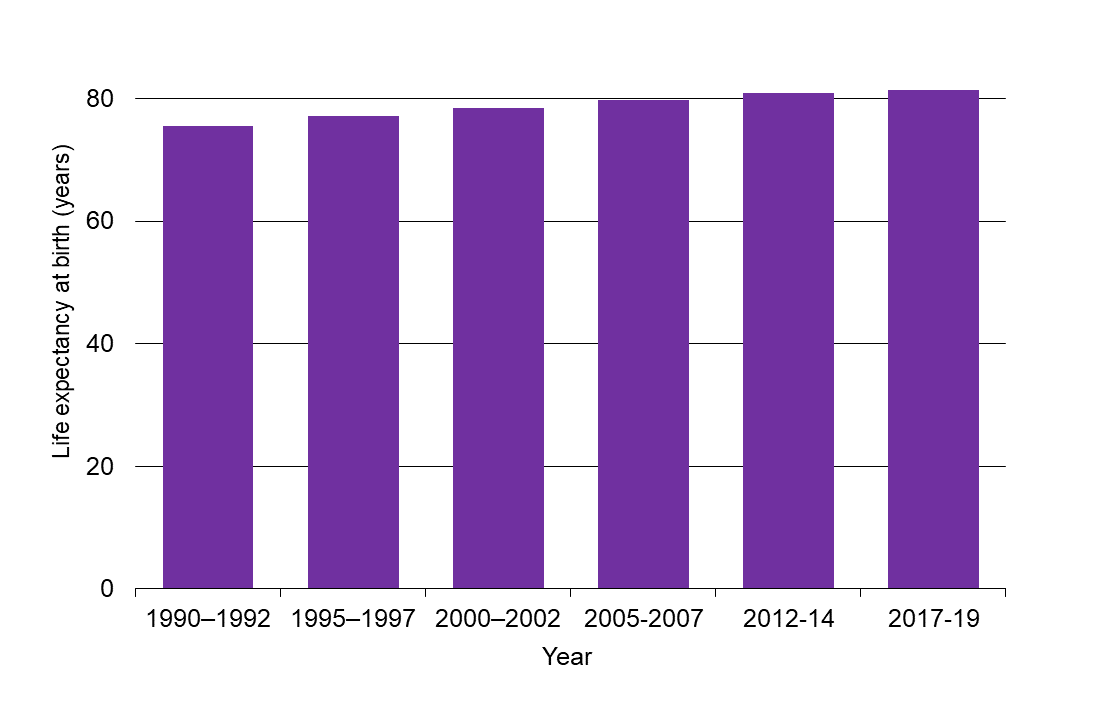
| Year | Life expectancy at birth (years) |
| 1990-1992 | 75.5 |
| 1995-1997 | 77.2 |
| 2000-2002 | 78.5 |
| 2005-2007 | 79.8 |
| 2012-2014 | 81.0 |
| 2017-2019 | 81.4 |
What is this indicator telling us?
- Life expectancy in the Waikato region is similar to the national average: approximately 80 years for males and 83 years for females. Gains in life expectancy since the mid-1980s can be attributed to better living standards and improved health care.
- The difference in life expectancy for males and females has been declining over time. In 1990-92, females in the Waikato region had a life expectancy 6 years greater than males, but by 2017-19 this had narrowed to 3.5 years.
- There remain marked differences in life expectancy between ethnic groups, with life expectancy for Māori remaining around eight years lower than that of the non-Māori population.
- There is some variation in average life expectancy between different territorial authority areas in the Waikato region, ranging from around 82-83 years in Otorohanga, Thames-Coromandel, Waipā and Matamata-Piako down to less than 80 years in South Waikato, Rotorua and Waitomo. These differences may be for a wide variety of reasons including age profiles and socio-economic status.
- New Zealand’s life expectancy is around two years higher than the Organisation for Economic Co-operation and Development (OECD) average of 80 years.
DATA SOURCE AND SUPPORTING INFORMATION
The time series from 1990-1992 for Waikato region and New Zealand was previously compiled by MARCO (Monitoring and Reporting Community Outcomes) and can be verified through the SNZ website (e.g. refer Life expectancy at birth in New Zealand by sex, Infoshare database).
Life Table data are reported separately for males and females. This indicator takes a simple average to arrive at estimated life expectancy for both sexes.
New Zealand Subnational Period Life Tables for 2017-19 were released in April 2021.
Update details: Most recent figures are from the 2018 Census results (next Census in 2023).
Customised data request requirements: Nil
DATA AVAILABILITY – OTHER THAN WAIKATO REGION:
Territorial Authority (TA) disaggregation: Yes
Other regions: Yes
New Zealand: Yes
Other countries/ Organisation for Economic Co-operation and Development (OECD): Secondary statistics from OECD Wellbeing Report: Health – Key findings. In particular, the OECD findings state that: 'life expectancy at birth in New-Zealand is 82 years, two years higher than the OECD average of 80 years. Life expectancy for women is 83 years, compared with 80 for men’.

To ask for help or report a problem, contact us
Tell us how we can improve the information on this page. (optional)