

Water use

 WATER USE
| |
WORSENING TREND |
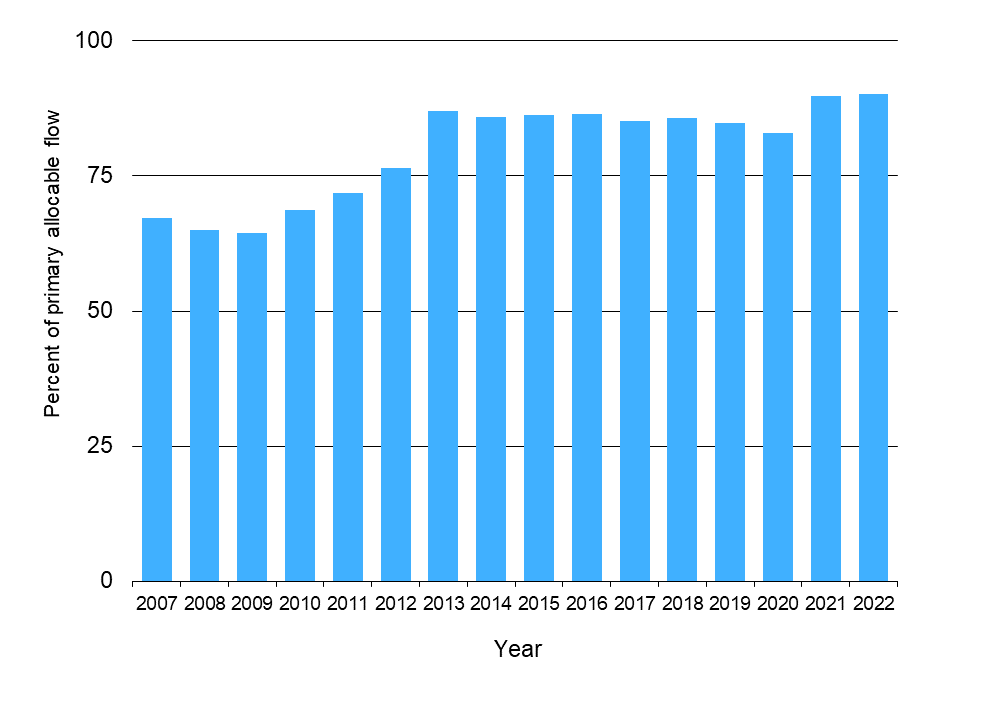
Between 2009 and 2013 there was a rapid and substantial increase in the volume of water allocated through resource consents compared to the primary allocable flow, with further increases occurring in recent years.
This indicator is the level of consented water allocation as a percentage of the primary allocable flow in the Waikato region, measured at the Waikato River mouth during summer months each year. Primary allocation is the maximum amount of water that can be taken from the catchment by holders of a consent classed as “primary” (as prescribed by Table 3-5 of the Regional Plan). Increased allocation of water exacerbates pressures on in-stream ecological water uses, even if it is within allocable limits, and hence represents a worsening trend.
Why is this indicator important?
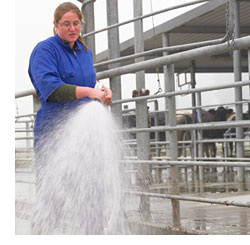
The Waikato region has an abundance of fresh water but not all of it is actually available to be used (allocable). Efficiency of water use is an increasingly important issue in the Waikato region. Much of it needs to be retained in our rivers, lakes and aquifers (underground springs) to maintain their ecological, recreational and other qualities. We also need to protect our water sources to ensure we have sufficient clean drinking water and water for household use.
Measuring how much water is allocated each year helps us to protect our non-allocable water sources, for example for fish and other animals and plants living in the water. It also helps us to ensure people’s personal water use requirements are not compromised by commercial or business-related uses for water. This can include water use on farms and manufacturing facilities; or anywhere where activities or processes require a large amount of water. Increased allocation of water exacerbates pressures on in-stream ecological water uses, even if it is within allocable limits, and hence represents a worsening trend.
Water use
| Year | Per cent of total allocable water allocated |
|---|---|
| 2007 | 67 |
| 2008 | 65 |
| 2009 | 64 |
| 2010 | 69 |
| 2011 | 72 |
| 2012 | 76 |
| 2013 | 87 |
| 2014 | 86 |
| 2015 | 86 |
| 2016 | 86 |
| 2017 | 85 |
| 2018 | 86 |
| 2019 | 85 |
| 2020 | 83 |
| 2021 | 90 |
| 2022 | 90 |
What is this indicator telling us?
- From 2009 to 2013, the amount of water allocated through resource consents as a percentage of the total water available to be allocated increased substantially. The percentage then stayed relatively constant at 85-87% of the primary allocable flow (as prescribed by Table 3-5 of the Regional Plan) until around 2020. The percentage allocated has grown higher following the Watercare consent being granted in January 2022.
- Variations since 2018 include expiry of water take consents without being replaced.
- During non-summer months, the allocation level is substantially less due to lower demand.
DATA SOURCE AND SUPPORTING INFORMATION
Data provided by Waikato Regional Council in the form of a spreadsheet.
Update details: Annual data are available from the Waikato Regional Council Water Calculator Database. Current yearly totals to 2022 were provided by Waikato Regional Council in May 2023.
Customised data request requirements: Contact Waikato Regional Council.
DATA AVAILABILITY – OTHER THAN WAIKATO REGION:
Territorial Authority (TA) disaggregation: No
Other regions: No
New Zealand: No
Other countries/ Organisation for Economic Co-operation and Development (OECD): No

To ask for help or report a problem, contact us
Tell us how we can improve the information on this page. (optional)