

Coastal ecosystem health

 COASTAL ECOSYSTEM HEALTH
| |
NO SIGNIFICANT CHANGE |
This indicator shows that most of the monitored sites are moderately healthy, and at most sites there were only slight changes in estuarine ecosystem health between 2012 and 2021. There is not yet enough data to analyse trends statistically.
Why is this indicator important?
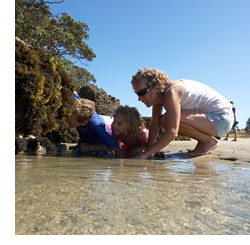
This indicator describes the diversity of animals that live in our estuaries. Estuaries are an important part of our coastal marine area. They are productive ecosystems, but are also one of the most sensitive coastal areas, and are at risk from human activities.
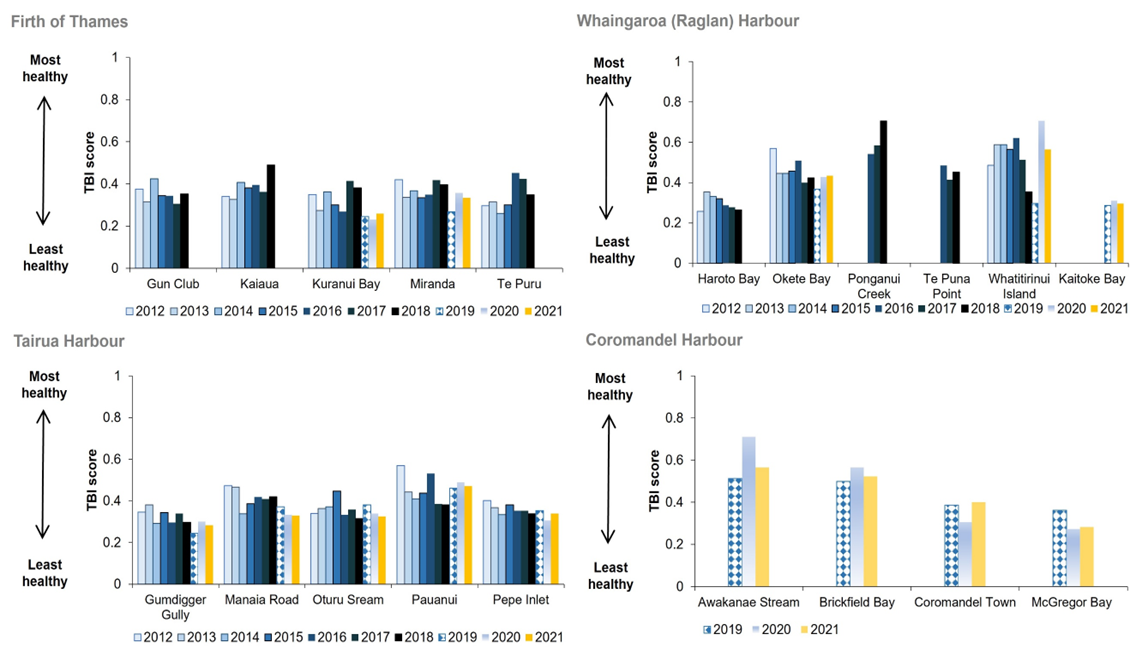
We currently monitor the sediment-dwelling animal communities in four estuaries: the southern Firth of Thames, Whāingaroa (Raglan) Harbour, Tairua Harbour and Coromandel Harbour. Sediment-dwelling animals (such as shellfish, crustaceans and marine worms) are important in estuaries because they cycle nutrients between the sediment and water, stabilise and rework sediments, and are an important food resource for birds, fish, and crabs. The animal community characteristics are summarised by a Traits Based Index that makes use of the animals’ biological traits. Biological traits are the physical and behavioural characteristics that define a particular species (e.g. body size, mobility, feeding behaviour).
The Traits Based Index (TBI) tells us about the health of our estuaries. It ranges between zero and one, with one being most healthy and zero being least healthy. We can use the TBI to track the health of our estuary sites over time, and to compare the health of different estuaries.
Ecosystem health at sites in monitored estuaries
TBI scores range between zero and one, with one being most healthy and zero being least healthy.
| TBI score (a measure of ecosystem health) | |||||||||||
| Estuary | Site | 2012 | 2013 | 2014 | 2015 | 2016 | 2017 | 2018 | 2019 | 2020 | 2021 |
| Firth of Thames | Gun Club | 0.380 | 0.310 | 0.420 | 0.344 | 0.344 | 0.306 | 0.353 | NA | NA | NA |
| Kaiaua | 0.340 | 0.330 | 0.410 | 0.381 | 0.395 | 0.362 | 0.489 | NA | NA | NA | |
| Kuranui Bay | 0.350 | 0.270 | 0.360 | 0.301 | 0.268 | 0.414 | 0.381 | 0.245 | 0.231 | 0.259 | |
| Miranda | 0.420 | 0.340 | 0.370 | 0.334 | 0.348 | 0.419 | 0.395 | 0.268 | 0.358 | 0.334 | |
| Te Puru | 0.300 | 0.310 | 0.260 | 0.301 | 0.452 | 0.424 | 0.348 | NA | NA | NA | |
| Whaingaroa (Raglan) Harbour | Haroto Bay | 0.260 | 0.350 | 0.330 | 0.320 | 0.287 | 0.278 | 0.264 | NA | NA | NA |
| Okete Bay | 0.570 | 0.450 | 0.450 | 0.456 | 0.508 | 0.400 | 0.424 | 0.367 | 0.428 | 0.433 | |
| Ponganui Creek | NA | NA | NA | NA | 0.541 | 0.584 | 0.706 | NA | NA | NA | |
| Te Puna Point | NA | NA | NA | NA | 0.485 | 0.414 | 0.452 | NA | NA | NA | |
| Whatitirinui Island | 0.490 | 0.590 | 0.590 | 0.565 | 0.621 | 0.513 | 0.353 | 0.296 | 0.706 | 0.565 | |
| Kaitoke Bay | NA | NA | NA | NA | NA | NA | NA | 0.287 | 0.311 | 0.296 | |
| Tairua Harbour | Gumdigger Gully | 0.350 | 0.380 | 0.290 | 0.344 | 0.296 | 0.339 | 0.296 | 0.245 | 0.301 | 0.282 |
| Manaia Road | 0.470 | 0.470 | 0.340 | 0.386 | 0.419 | 0.409 | 0.419 | 0.372 | 0.334 | 0.329 | |
| Oturu Sream | 0.340 | 0.360 | 0.370 | 0.447 | 0.334 | 0.358 | 0.315 | 0.381 | 0.339 | 0.325 | |
| Pauanui | 0.570 | 0.440 | 0.410 | 0.438 | 0.532 | 0.386 | 0.381 | 0.461 | 0.489 | 0.471 | |
| Pepe Inlet | 0.400 | 0.370 | 0.330 | 0.381 | 0.353 | 0.353 | 0.339 | 0.353 | 0.306 | 0.339 | |
| Coromandel Harbour | Awakanae Stream | NA | NA | NA | NA | NA | NA | NA | 0.513 | 0.711 | 0.565 |
| Brickfield Bay | NA | NA | NA | NA | NA | NA | NA | 0.499 | 0.565 | 0.522 | |
| Coromandel Town | NA | NA | NA | NA | NA | NA | NA | 0.386 | 0.306 | 0.400 | |
| McGregor Bay | NA | NA | NA | NA | NA | NA | NA | 0.362 | 0.273 | 0.282 | |
To provide a broad, summary indication of overall regional coastal ecosystem health, the average of the results from each site are shown below.
Average Traits Based Index (TBI) scores for monitored sites

| Year |
Regional index (average of all sites) |
| 2012 | 0.40 |
| 2013 | 0.38 |
| 2014 | 0.38 |
| 2015 | 0.38 |
| 2016 | 0.41 |
| 2017 | 0.40 |
| 2018 | 0.39 |
| 2019 | 0.36 |
| 2020 | 0.40 |
| 2021 | 0.39 |
What is this indicator telling us?
- Many of the sites are moderately healthy (having a TBI score between 0.3 and 0.4), some are in poor health (having a TBI score less than 0.3), and some are in relatively good health (having a TBI score greater than 0.4).
- At most sites, there were only slight changes in the TBI, and therefore in estuarine health, between 2012 and 2021. We expect the TBI score to vary slightly from year-to-year due to natural variability. There is not yet enough data to analyse trends statistically.
DATA SOURCE AND SUPPORTING INFORMATION
Data sourced from Waikato Regional Council’s Regional Estuary Monitoring Programme: https://www.waikatoregion.govt.nz/regional-estuary-monitoring-programme/
Update details: Monitoring is carried out on an annual basis.
Customised data request requirements: Request is for the Traits Based Index calculated for sites in the Regional Estuary Monitoring Programme.
DATA AVAILABILITY – OTHER THAN WAIKATO REGION:
Territorial Authority (TA) disaggregation: No
Other regions: No
New Zealand: No
Other countries/ Organisation for Economic Co-operation and Development (OECD): No

To ask for help or report a problem, contact us
Tell us how we can improve the information on this page. (optional)