

Air quality

AIR QUALITY
| IMPROVING TREND |
There was a substantial reduction in the level of fine particles in the air in our urban areas between the mid-2000s and 2020. The evidence for continuing reduction since then is no longer apparent.
This indicator measures the number of times the regional guideline for the level of fine particles in our air has been exceeded each year, across all air quality monitoring sites in urban areas within the Waikato region.
Why is this indicator important?
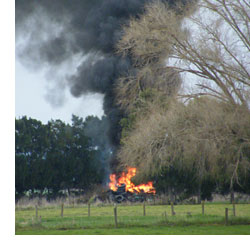
Fine particles in the air are referred to as ‘PM10’ particles – those which are smaller than 10 microns (1000 microns = 1 millimetre). Sources of PM10 particles include vehicle emissions, industry emissions and home fires.
PM10 can affect people’s health, causing respiratory problems, especially for asthmatics, small children and the elderly. Some affected people can end up in hospital. For those who are particularly sensitive, the effects of high levels of PM10 can be fatal. PM10 also affects air by reducing visibility, which if particularly severe, could affect the safety of people moving around our urban areas on foot or by road.
Monitoring these sites helps councils to identify and manage air quality issues. When sources of excessive PM10 emissions can be identified, councils can work with the people or organisations involved to help them reduce their output of PM10 and comply with the National Environmental Standards for Air Quality. Raising awareness of what contributes to high levels of PM10 in our air – and the effects it can have - also helps people find out what they can do to keep PM10 levels down (for example, by not burning wet wood, as this produces high PM10 levels).
Air quality exceedances
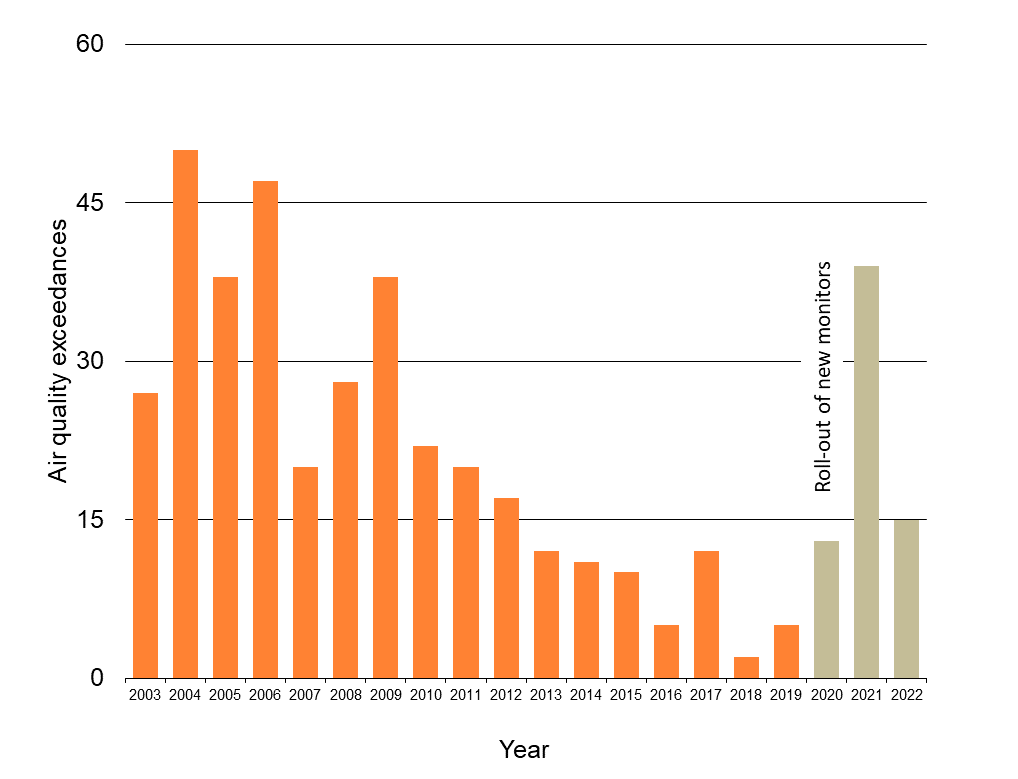
| Year | Air quality exceedances |
| 2003 | 27 |
| 2004 | 50 |
| 2005 | 38 |
| 2006 | 47 |
| 2007 | 20 |
| 2008 | 28 |
| 2009 | 38 |
| 2010 | 22 |
| 2011 | 20 |
| 2012 | 17 |
| 2013 | 12 |
| 2014 | 11 |
| 2015 | 10 |
| 2016 | 5 |
| 2017 | 12 |
| 2018 | 2 |
| 2019 | 5 |
| 20201 | 13 |
| 20212 | 39 |
| 2022 | 15 |
Notes: (1) Increases in the number of exceedances from around 2019/20 may be attributed to the roll-out of new optical based monitors which measure a higher number of exceedances than the older monitors. Other regions have also identified increases in the number of exceedances due to the recent introduction of these new monitors. (2) In last year’s WPI update, the 2021 regional total was incorrectly cited as 49 (not 39) due to the mistaken application of a correction factor to the Taupō data.
What is this indicator telling us?
- PM10 levels throughout the Waikato region are good or acceptable for most of the year. However, for a few days each year in some locations, typically on calm winter days, levels of fine particles in our air exceed the National Environmental Standard (NES) as well as the regional guidelines.
- The majority of PM10 in urban areas is from home fires, mainly from burning wood in winter. Other sources such as industry and emissions from motor vehicles can also contribute to air pollution.
- The number of annual exceedances in Tokoroa continues to be higher than NES targets, mostly due to non-compliant fireplaces and burning wet wood.
- Taupō and Te Kūiti are also no longer meeting the NES targets which is also mostly attributed to non-compliant fireplaces and burning wet wood.
- Increases in the number of exceedances from around 2019/20 may be attributed to the roll-out of new optical based monitors which measure a higher number of exceedances than the older monitors. Other regions have also identified increases in the number of exceedances due to the recent introduction of these new monitors.
- New Zealand has no national standard for PM2.5 (fine particulate matter) concentrations and only a few sites in major cities monitor such concentrations, but PM2.5 is now being monitored in Tokoroa, Te Kūiti, Taupō and Hamilton. Current amendments to the NES are likely to introduce long and short term PM2.5 standards which are anticipated to be aligned with recent updates to the World Health Organisation guidelines. PM2.5 will then replace PM10 as the main air quality indicator.
- Overall, New Zealand has a low annual average level of particulate matter in urban areas by international standards. The OECD air quality update based on latest available 2019 data indicates that New Zealand has the fourth lowest mean population exposure to fine particulate out of all OECD countries (just slightly higher than Estonia, Sweden and Finland).
DATA SOURCE AND SUPPORTING INFORMATION
Data for Waikato monitoring sites are available online annually via Waikato Regional Council’s Environmental Indicators > Air Quality.
Data for most monitoring sites throughout New Zealand, and for selected countries similar to New Zealand, are reported through the Environmental Health Indicators New Zealand (EHINZ) website.
Data for regional council monitoring sites throughout New Zealand are also reported through the Land, Air, Water Aotearoa (LAWA) - Air Quality site.
International data are available from the OECD.
Update details: Annual data to 2022 with 2023 results expected in early 2024.
Customised data request requirements: Waikato Regional Council Environmental Scientist.
DATA AVAILABILITY – OTHER THAN WAIKATO REGION:
Territorial Authority (TA) disaggregation: No
Other regions: No
New Zealand: No
Other countries/ Organisation for Economic Co-operation and Development (OECD): Yes (selected countries reported by the Ministry for the Environment)

To ask for help or report a problem, contact us
Tell us how we can improve the information on this page. (optional)