

Greenhouse gases

 GREENHOUSE GASES
| NO SIGNIFICANT CHANGE |
(note: trend indicator above is relative to 2007 WPI baseline year.)
Annual greenhouse gas emission levels appear to have stabilised, subject to annual fluctuations. Substantial decreases are needed in the coming years to support the achievement of national and regional targets.
This indicator shows the trend in total greenhouse gas emissions based on Statistics New Zealand’s annual regional greenhouse gas emissions estimates. This is supplemented by information from an inventory of the Waikato region’s community-scale greenhouse gas emissions which is compiled every three years.
Why is this indicator important?
Climate change is an issue requiring urgent collective action at the local, regional, national and international levels. According to the Intergovernmental Panel on Climate Change (Sixth Assessment Report, p. 63), human-induced climate change is a consequence of more than a century of net GHG emissions from unsustainable energy use, land-use and land use change, lifestyle and patterns of consumption and production.
The effects of these gases have been documented in compelling evidence of climate change gathered from scientific observations of changes to the atmosphere, land, oceans and cryosphere (for example, ice core records). There is evidence of climate change effects, including raised temperatures and sea levels and increased frequency of extreme weather events. The occurrence of these changes is projected to become more pronounced, and the rate of change more rapid over time. Changes in climate can have major impacts on our safety, health, economy and infrastructure, and where and how we live.
Future generations will be confronted with increasingly severe impacts including rising temperatures, more extreme weather, sea level rise and disruption to marine and land ecosystems.
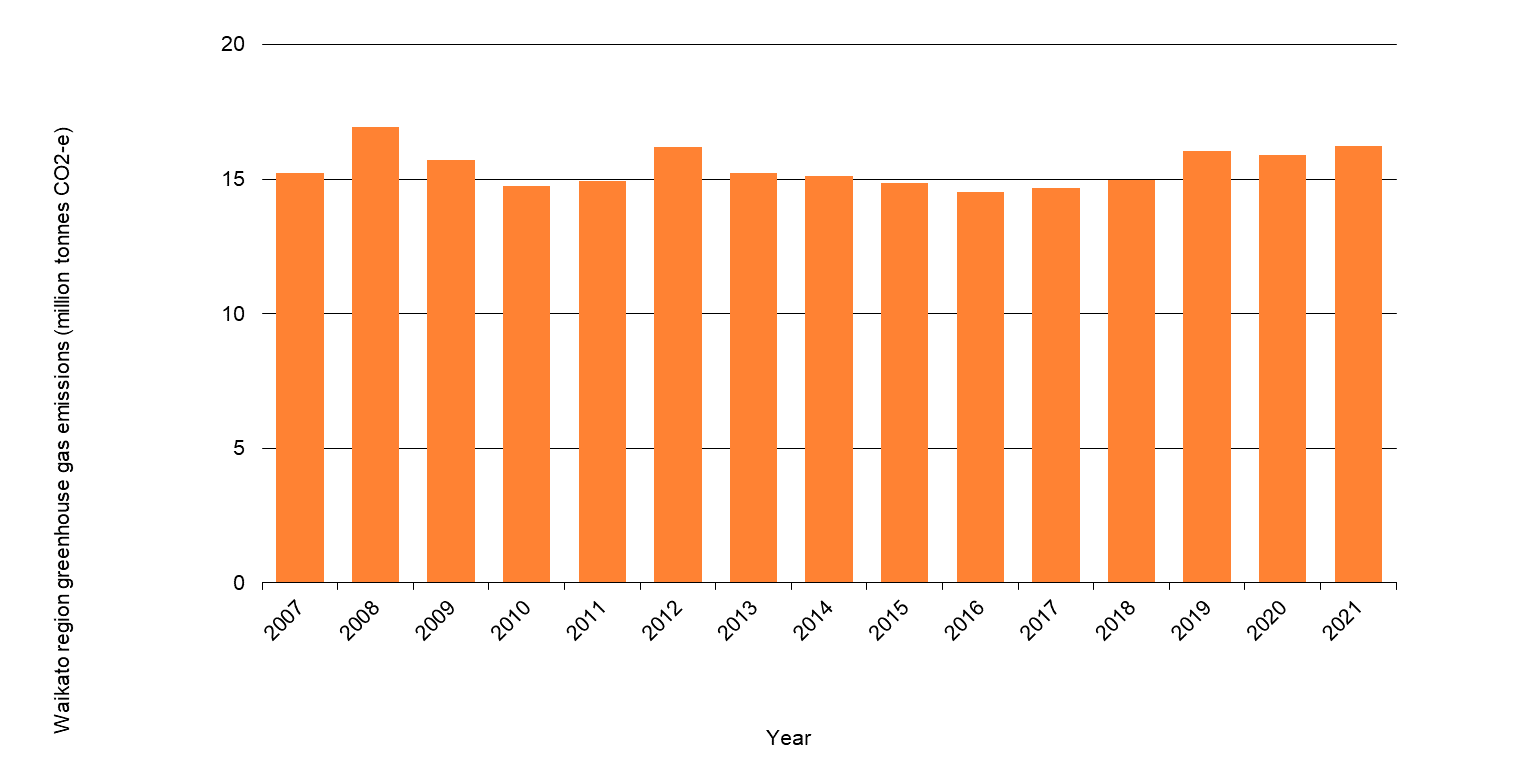
Waikato region greenhouse gas emissions (million tonnes CO2 equivalents)
| Year | Waikato regional total gross greenhouse gas emissions (million tonnes CO2 equivalent) |
| 2007 | 15.2 |
| 2008 | 16.9 |
| 2009 | 15.7 |
| 2010 | 14.7 |
| 2011 | 14.9 |
| 2012 | 16.2 |
| 2013 | 15.2 |
| 2014 | 15.1 |
| 2015 | 14.8 |
| 2016 | 14.5 |
| 2017 | 14.7 |
| 2018 | 15.0 |
| 2019 | 16.0 |
| 2020 | 15.9 |
| 2021 | 16.2 |
Note: Excludes land use or loss of soil carbon from activities such as peat drainage (estimated to be 1.5Mt CO2e per year).
What is this indicator telling us?
- According to Statistics New Zealand’s regional greenhouse gas emissions estimates, activities within Waikato region’s boundaries generated approximately 16.2 million tonnes of carbon dioxide equivalent (Mt CO2e) in 2021, compared to 15.2 in 2007. Annual estimates have fluctuated between a high of 16.9 million in 2008 and low of 14.5 million in 2016.
- Compared to all other regions, Waikato is New Zealand’s highest emitter of carbon dioxide equivalents (CO2e). The Waikato region has the highest emissions of methane and nitrous oxide, and second highest for carbon dioxide (behind Auckland.) Agriculture contributes approximately half of Waikato's CO2e emissions. In 2021, 48 per cent of Waikato’s total emissions were from carbon dioxide and a further 39 per cent from methane.
- According to Waikato Regional Council’s latest regional greenhouse gas inventory for 2018/19, on a per capita basis, Waikato’s agricultural emissions are more than double the national per capita average. Conversely, the region’s exotic production forests sequester more than double the national average.
- Due to its emissions profile, Waikato Region needs to focus its reduction efforts on agriculture as well as consider options for maintaining or increasing its carbon removal potential, through a mixture of production and protection forests using both exotic and indigenous species according to land characteristics and capability. Within agriculture, a focus on methane emissions reduction is needed since it makes up about 80% of agricultural emissions.
- Waikato Regional Council’s per capita net emissions estimates at the territorial authority level indicate that Ōtorohanga has the highest rate at 82.9 tonnes CO2e per capita, with Taupō at the other extreme with a net emissions reduction of -34.4 tonnes CO2e per capita. These are not intended as a benchmark between territorial authorities but simply as an indicative framework of reference to understand the range of differences between emissions profiles.
- According to the Ministry for the Environment’s New Zealand Greenhouse Gas Inventory, national gross emissions peaked in 2006. Between 2020 and 2021, gross emissions decreased by 0.7 per cent, largely because of a decrease in emissions from the agriculture sector (by 1.5 per cent) driven partly by lower dairy cattle population and a decrease in fertiliser use.
- Comparing emissions growth to real GDP over time suggests there has been a relative decoupling of economic growth from emissions growth in recent decades. For example, New Zealand’s real GDP increased at an average annual rate of 3.1 percent over the period 1990 to 2015 while emissions increased at an average 0.9 percent per annum over the same period (0.5 percent for primary industries, 1.2 for goods-producing industries, 2.2 for service industries) (source: Statistics New Zealand’s Environmental-economic accounts 2018).
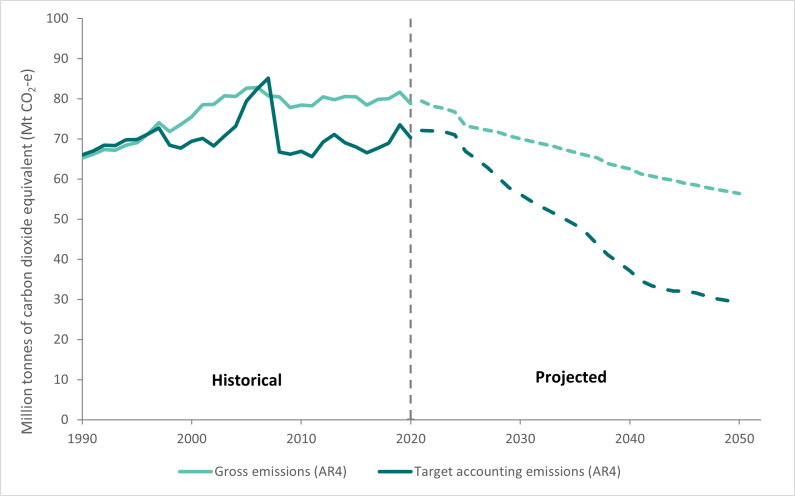
- The Ministry for the Environment publishes projections of New Zealand’s greenhouse gas emissions as part of its climate change commitments. Latest projections show that New Zealand’s target accounting emissions are projected to see a 37 per cent reduction on 2020 levels by 2050. With existing measures only, gross emissions are projected to gradually decrease to 19.7 per cent below 2018 levels in 2050. The projected gradual decline in gross emissions is from reduced energy use, land-use change from agriculture to forestry, the further shift to low carbon renewables in stationary energy and increasing energy efficiency and electrification in transport. Under target accounting, forestry is projected to account for most of the decrease in net emissions to 2050, with relatively low decreases in emissions from the other sectors.
New Zealand’s historical and projected greenhouse gas emissions from 1990 to 2050
DATA SOURCE AND SUPPORTING INFORMATION
Estimates of regional greenhouse gas emissions since 2007 are produced by Statistics New Zealand by allocating national emissions by residence of economic units and household (refer www.stats.govt.nz/methods/about-regional-greenhouse-gas-emissions-statistics). For each release, the historical series is recalculated as input data is revised, including both national-level benchmarks and indicators used to allocate to regions. This also allows methodological changes that improve how SNZ allocate to regions to apply to the entire time series.
Waikato regional data are also available from the Waikato Region Comprehensive Greenhouse Gas Inventory. The first period for the regional inventory is 2015-16, followed by 2018-19 data published in mid-2020. The regional inventory was compiled following the Global Protocol for Community-Scale Greenhouse Gas Emissions Inventories (GPC), which is considered best practice for community-based inventories.
Starting from 2018-19, individual emissions inventories have also been prepared by Waikato Regional Council for each of the 10 districts of Waikato region: Hamilton City, Waikato, Hauraki, Thames Coromandel, Waitomo, Matamata Piako, Ōtorohonga, Waipā, South Waikato and Taupō . This was the first attempt to provide districts emissions breakdown and the expectation is that the insights will enable collaborations and actions for climate mitigation.
The next Waikato Regional Council regional inventory will be completed in August 2023 using information from the 2021–22 financial year.
National data are published annually in April through the Ministry for the Environment (MfE) website – New Zealand’s Greenhouse Gas Inventory. Summary data can be sourced from the Interactive Emissions Tracker data (gross emissions, time series). Figures relate to New Zealand’s annual total greenhouse gas emissions (CO2 equivalent). Total emissions include those from the energy, industrial processes, solvent and other product use, agriculture and waste sectors, but do not include net removals from the ‘LULUCF’ sector (Land Use, Land Use Change and Forestry). New Zealand’s total (and net) emissions under the Climate Change Convention from 1990 to most recent year are plotted in the Inventory Report, and latest figures are cited and tabulated in the text and downloadable.
Information on trends in the link between greenhouse gas emissions and GDP growth are from Statistics New Zealand’s Environmental-economic accounts 2018: www.stats.govt.nz/information-releases/environmental-economic-accounts-2018.
Projections of New Zealand’s greenhouse gas emissions are published in national communication and biennial reports tracking progress towards meeting internationally-agreed climate change commitments: https://environment.govt.nz/site-search/?keyword=projected%20greenhouse
Update details: Annual regional data release in September.
Customised data request requirements: Nil
DATA AVAILABILITY – OTHER THAN WAIKATO REGION:
Territorial Authority (TA) disaggregation: Yes (WRC estimates).
Other regions: Yes (but not comparable due to differing region size, population density, natural features etc)
New Zealand: Yes
Other countries/ Organisation for Economic Co-operation and Development (OECD): Yes

To ask for help or report a problem, contact us
Tell us how we can improve the information on this page. (optional)