

Indigenous vegetation

 INDIGENOUS VEGETATION
| NO SIGNIFICANT CHANGE |
There is relatively little change in the extent of indigenous vegetation within the Waikato region each year. Between 2012 and 2018 the Land Cover Database reports a net loss of 312 hectares of indigenous scrub and shrubland and 89 hectares of indigenous forest.
This indicator is the percentage of land covered in indigenous forest, scrub and tussock in the Waikato region.
Why is this indicator important?
Areas of indigenous vegetation are an important storehouse of indigenous biodiversity. The native plants and trees of New Zealand are unique, having evolved in isolation for millions of years and provide a valuable place for our native animals to live in. Small sections of indigenous vegetation such as forest fragments can provide a ‘corridor’ between larger areas, providing links for native birdlife to move between areas. New Zealand is known internationally for its unusual plants and animals, many of which are found nowhere else in the world.
Loss of habitat, along with the introduction of animal and plant pests, has had a major role in extinctions and the high number of threatened species in New Zealand. Identifying and monitoring our areas of indigenous vegetation enables councils, individuals and environmental groups to work together to manage and preserve these areas for future generations.
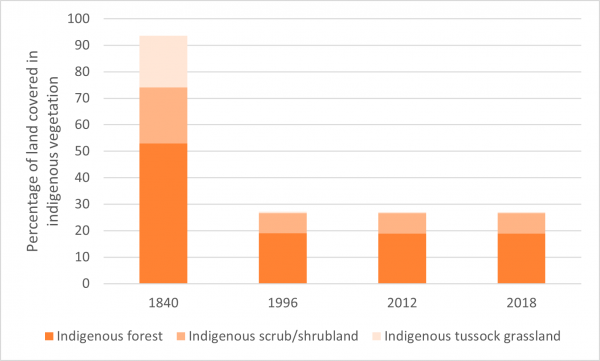
Percentage of land covered in indigenous vegetation
| Year | Indigenous forest | Indigenous scrub/ shrubland | Indigenous tussock grassland | Total |
|---|---|---|---|---|
| 1840 | 53 | 21 | 19 | 94 |
| 1996 | 19 | 8 | 0 | 27 |
| 2012 | 19 | 8 | 0 | 27 |
| 2018 | 19 | 8 | 0 | 27 |
What is this indicator telling us?
- Before European settlement (around 1840), 94 per cent of the Waikato region’s total area of 2.4 million hectares was covered in terrestrial indigenous (native) vegetation, with the remaining 6 per cent being wetlands, bare rock, permanent snow and ice, or areas of Māori cultivation or inhabitation. Forest covered 53 per cent of the region. Scrub and shrubland or tussock grassland covered a further 41 per cent, mostly in areas where fires were frequent, or the land too wet or cool for forest.
- Change in land use, for example to agriculture, plantation forestry and urban settlement, required clearing indigenous vegetation. Today around 648,905 hectares (27 per cent of the region’s land area) remains in terrestrial (land-based) indigenous vegetation cover, mostly indigenous forest (19 per cent of the region), and scrub and shrubland (8 per cent).
- The greatest loss of terrestrial indigenous vegetation since 1840 occurred in the central Waikato lowlands, around Hamilton City and in the Waipā, Waikato, South Waikato and Matamata-Piako districts where fertile soils on gentler topography were suitable for livestock farming, or where the hills were cleared for pine plantations. Districts with more rugged hill country and extensive ranges, such as Taupō, Ōtorohanga, Waitomo and Thames-Coromandel have a greater proportion of indigenous forest, scrub and shrubland and tussock remaining.
- Since 1996, the Land Cover Database (LCDB) records an estimated net loss of around 530 hectares of indigenous forest and 1240 hectares of indigenous scrub and shrubland, along with a gain of 46 hectares of indigenous tussock grassland. Between 1996 and 2012 the region lost terrestrial indigenous vegetation at an average rate of 85 hectares per year.
- Between 2012 and 2018 the net rate of loss dropped to around 60 hectares per year. In that time the Land Cover Database reports a net loss of 89 hectares of indigenous forest and 312 hectares of indigenous scrub and shrubland. The actual amount of indigenous forest loss is considered to be much less (around 14 hectares) based on a visual assessment of the LCDB polygons that changed from indigenous forest to another land cover type against time-series Google Earth images. Many of the cleared areas classified as indigenous forest were either exotic forest or an indigenous scrub and shrubland class in 2012.
- Today just over a quarter of the region’s land remains in indigenous vegetation, most of it forest. The areas that have lost the most indigenous vegetation tend to be coastal and fertile lowland areas, around Hamilton City and in the Waipa, Waikato, South Waikato and Matamata-Piako districts.
- Between 2012 and 2018 there was a further net decrease of an estimated 356 hectares, with the greatest losses being manuka/kanuka and indigenous forest, partially offset by increased areas of broadleaved indigenous hardwoods and tall tussock grassland.
- The amount of scrub and shrubland lost since 2012, through clearance or natural causes such as fire, was 619 hectares, but this was offset by a gain of 307 hectares, mostly through natural regeneration in areas of former exotic forest plantation.
- By international comparison, New Zealand has a large proportion of its land area legally protected for conservation purposes (32.9% in 2020).
DATA SOURCE AND SUPPORTING INFORMATION
Waikato Regional Council monitors changes in the amount of indigenous vegetation on land in the region using data from satellite photographs (Land Cover Database). A Regional Indigenous Vegetation Inventory provides an estimate of historic vegetation (1840).
During 2014, Waikato Regional Council completed a similar regional indicator of indigenous (native) vegetation coverage in the Waikato region's protected areas. These areas include land legally protected by the Department of Conservation, QEII Trust, Ngā Whenua Rāhui and District Council Reserves. The protection of the region's threatened National Priority 1 Environments is also analysed.
Update details: Data only available for 1840, 1996, 2012 and 2018.
Customised data request requirements: Nil
DATA AVAILABILITY – OTHER THAN WAIKATO REGION:
Territorial Authority (TA) disaggregation: Yes
Other regions: Yes
New Zealand: Yes
Other countries/ Organisation for Economic Co-operation and Development (OECD): OECD data portal – Protected areas.

To ask for help or report a problem, contact us
Tell us how we can improve the information on this page. (optional)