Life satisfaction

 LIFE SATISFACTION
| WORSENING TREND |
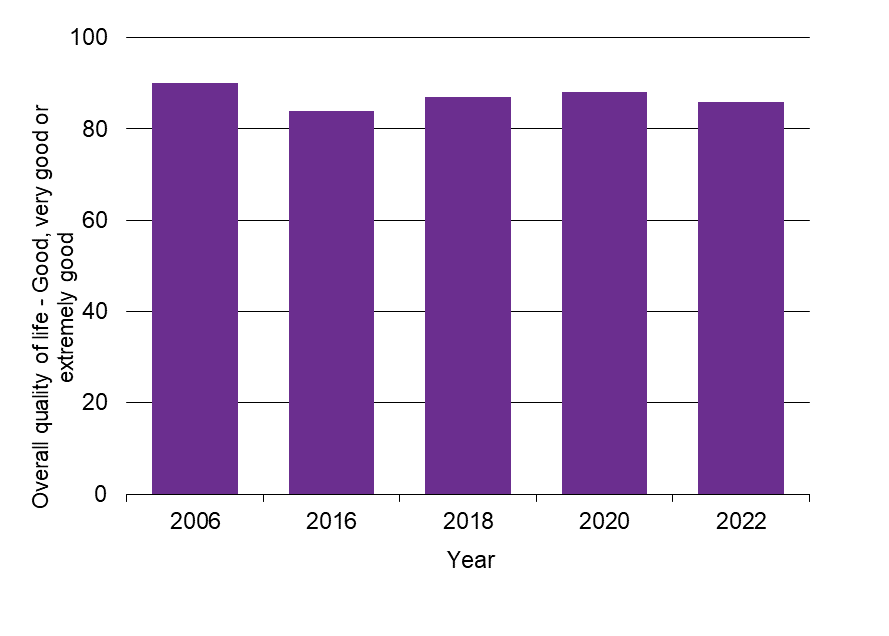
Perceived overall quality of life in the Waikato region is lower in 2022 compared with 2006.
This indicator is self-reported overall life satisfaction for people living in the Waikato region, drawn from the Quality of Life Survey.
Why is this indicator important?
People's satisfaction with their overall quality of life provides a self-assessed measure of wellbeing. How people feel about their life is a fundamental measure for the health of our communities. This measure also relates to self-reported happiness and general wellbeing. We can use this information to help us make decisions aimed at increasing positive levels of wellbeing and life satisfaction for people living in this region and beyond.
Life satisfaction

Note 1: In 2018 the survey question changed from a 5-point to 7-point scale. Subsequently measured as percent good, very good or extremely good. Comparison of 2016 and 2018 results by Nielsen confirmed this has not caused any systematic changes to push the positive result up or down.
Note 2: From 2020, WPI results are based on a question asked at the beginning of the questionnaire, not near the end as in previous surveys, which may have slightly increased the results compared to earlier data.
| Year | Good or extremely good |
| 2006 | 90 |
| 2016 | 84 |
| 2018 | 87 |
| 2020 | 88 |
| 2022 | 86 |
What is this indicator telling us?
- Waikato regional survey respondents rated their overall quality of life lower in 2022 than in the 2006 survey (86% compared to 90% in 2006).
- Across the Waikato region in 2022:
- The percentage of people who reported a good, very good or extremely good overall quality of life ranged from 76% in Waitomo district up to 91% in Thames-Coromandel district and 93% in the rural part of the Rotorua district that is within the Waikato region.
- Respondents who identified with the New Zealand European/ Other ethnic group were more likely to rate their overall quality of life positively (89%)
- Respondents who identified with the Māori and Pacific ethnic groups were less likely to rate their overall quality of life positively (76% and 70% respectively).
- Respondents aged under 25 years were less likely to rate their overall quality of life positively (78%) and respondents aged over 65 years were more likely (91%).
- Based on a similar question in the 2021 New Zealand General Social Survey, drawn from a New Zealand-wide sample, respondents from the Waikato region rated their overall life satisfaction an average of 7.8 compared to 7.7 for New Zealand overall (sampling error was ±0.2% for Waikato results at 95% confidence level). Based on NZGSS time series data since 2014, there is little difference between regions and little change over time, at least in the short-term.
- In general, New Zealanders are more satisfied with their lives than the OECD average. When asked to rate their general satisfaction with life on a scale from 0 to 10, New Zealanders gave it a 7.3 grade, higher than the OECD average of 6.7.
DATA SOURCE AND SUPPORTING INFORMATION
This indicator is the percentage of people who rate their overall quality of life as good or extremely good (2006 and 2016 survey) or good, very good or extremely good (2018 survey onwards). Data are from the Quality of Life Survey.
The latest NZGSS results for 2021 were released in July 2022. NZGSS time series results for this item are not comparable prior to 2014 due to a change in the measurement scale.
Update details: Waikato regional results are available for 2006, 2016, 2018, 2020 and 2022.
Customised data request requirements: Quality of Life data.
DATA AVAILABILITY – OTHER THAN WAIKATO REGION:
Territorial Authority (TA) disaggregation: Yes
Other regions: Yes
New Zealand: No (but an 8-cities average is available)
Other countries/Organisations for Economic Co-operation and Development (OECD): OECD Wellbeing Report: Life satisfaction – Key findings


To ask for help or report a problem, contact us
Tell us how we can improve the information on this page. (optional)