

Soil quality

 SOIL QUALITY
| IMPROVING TREND |
The percentage of monitoring sites in the Waikato region with high soil quality has increased considerably compared to a decade ago.
This indicator is the estimated percentage of soil quality monitoring sites in the Waikato region meeting five or more of the seven soil quality targets.
Why is this indicator important?
Measuring soil quality for four main land use types in the Waikato region helps councils assess whether they are suited to the activities they support. These activities include dairy farming, drystock farming (sheep, beef, deer etc.), horticulture and cropping, and plantation forestry. Good quality soils are those whose key characteristics are in good condition for their current land use. Soils with good soil quality are able to carry out vital but sometimes conflicting soil functions. Some of the most important functions are food and other biomass production or a platform for man-made structures, biological habitat and gene pool or a source of raw materials, and several regulating services, such as water storage and supply, nutrient storage and supply, filtering contaminants and storage of carbon as soil organic matter to mitigate climate change.
Monitoring these sites helps councils to identify and manage issues so they can protect or improve soil quality in these areas through their policies and plans, regulation and education. This includes working directly with people involved in activities or industries that can have a significant impact on the land, to ensure our region’s soils remain viable now and in the future.
Soil quality
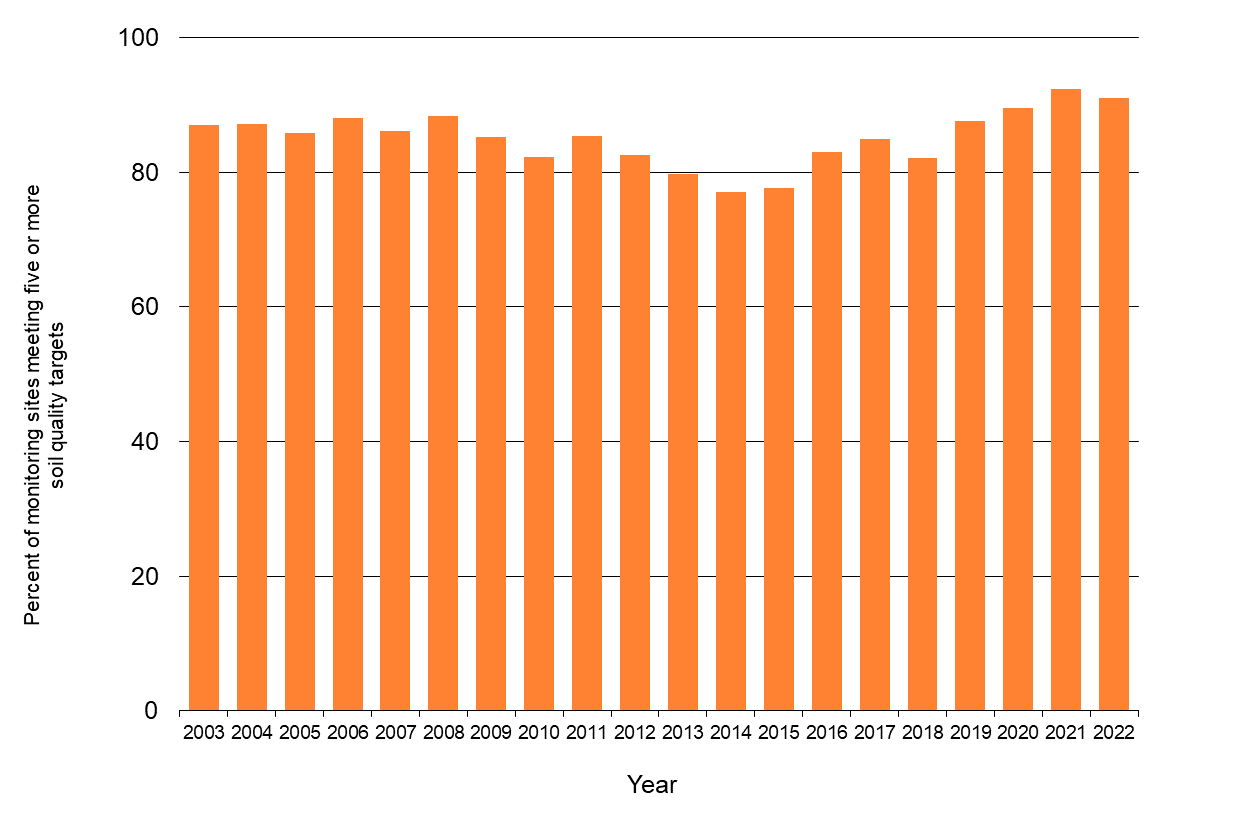
Note: percentages are corrected for productive land area.
| Year | Percent of monitoring sites meeting five or more soil quality targets |
| 2003 | 87 |
| 2004 | 87 |
| 2005 | 86 |
| 2006 | 88 |
| 2007 | 86 |
| 2008 | 88 |
| 2009 | 85 |
| 2010 | 82 |
| 2011 | 85 |
| 2012 | 82 |
| 2013 | 80 |
| 2014 | 77 |
| 2015 | 78 |
| 2016 | 83 |
| 2017 | 85 |
| 2018 | 82 |
| 2019 | 88 |
| 2020 | 90 |
| 2021 | 92 |
| 2022 | 91 |
What is this indicator telling us?
- The percentage of soil quality monitoring sites in the Waikato region which met five or more soil quality targets has improved substantially since 2014 and is now higher than WPI baseline levels. The result for 2022 was 91% compared to 86% in 2007.
DATA SOURCE AND SUPPORTING INFORMATION
Waikato Regional Council monitors soil quality sites throughout the region against seven targets agreed by the National Land Monitoring Forum: total carbon (organic matter), total nitrogen (N), mineralised N, soil pH (acidity/alkalinity), phosphorous (P), soil density and macroporosity (a measure of the ability for air and water to penetrate the soil).
Data for this indicator were provided by Waikato Regional Council, consistent with Taylor, M., Cox, N., Littler, R. and Drewry, J. (2017) 'Trends in soil quality monitoring data in the Waikato region 1995-2015', Waikato Regional Council Technical Report 2017/26. Waikato Regional Council, Hamilton.
Comparisons with New Zealand and other regions are expected to be available in future via the Waikato Regional Council Soil Scientist.
Update details: Annual data to 2022 were sourced in May 2023.
Customised data request requirements: Contact is Waikato Regional Council for the estimated percentage of total productive land in the Waikato region meeting five or more soil quality targets and related secondary indicators.
DATA AVAILABILITY – OTHER THAN WAIKATO REGION:
Territorial Authority (TA) disaggregation: No
Other regions: No
New Zealand: No
Other countries/ Organisation for Economic Co-operation and Development (OECD): No

To ask for help or report a problem, contact us
Tell us how we can improve the information on this page. (optional)