

Voter turnout
![]()

VOTER TURNOUT
| IMPROVING TREND |
Average voter turnout in 2019 was above the 2007 baseline but remains relatively low compared to historical rates.
This indicator is the average voter turnout in local councils, Waikato District Health Board (WDHB) and regional council elections in the Waikato region.
In the next update, following release of the 2022 election results, the WPI average voter turnout will be calculated from local and regional council data only. From 2022, DHBs have been replaced by Te Whatu Ora – Health New Zealand.
Why is this indicator important?
Voter turnout is an indicator of community engagement and political participation. It reflects the extent to which we all feel we are a part of the political process. It also shows the level of importance we attach to political institutions. Low voter turnout can affect the degree to which a politician or a political institution can be seen as truly representing what people in their electorate want for their region and for New Zealand.
Analysis by Local Government New Zealand (LGNZ) has identified that voting behaviour is influenced by a number of factors, such as the level of education, age, civic literacy and length of time that a person has lived at the same address. These factors can also impact on the turnout rates of different ethnic groups. For example, an ethnic group which is older, more qualified, and with higher rates of home ownership would also be expected to vote at higher rates than other groups.
Measuring voter turnout can indicate where more work needs to be done to better engage the voting public to enable an improved connection between the community and local and central government. According to LGNZ, people who are not aware of the role of local government are less likely to vote. A council with a high level of relevance, or ‘salience’, is one that provides incentives for citizens to invest the time and energy necessary to search information on candidates and monitor the performance of their local authorities.
Voter turnout
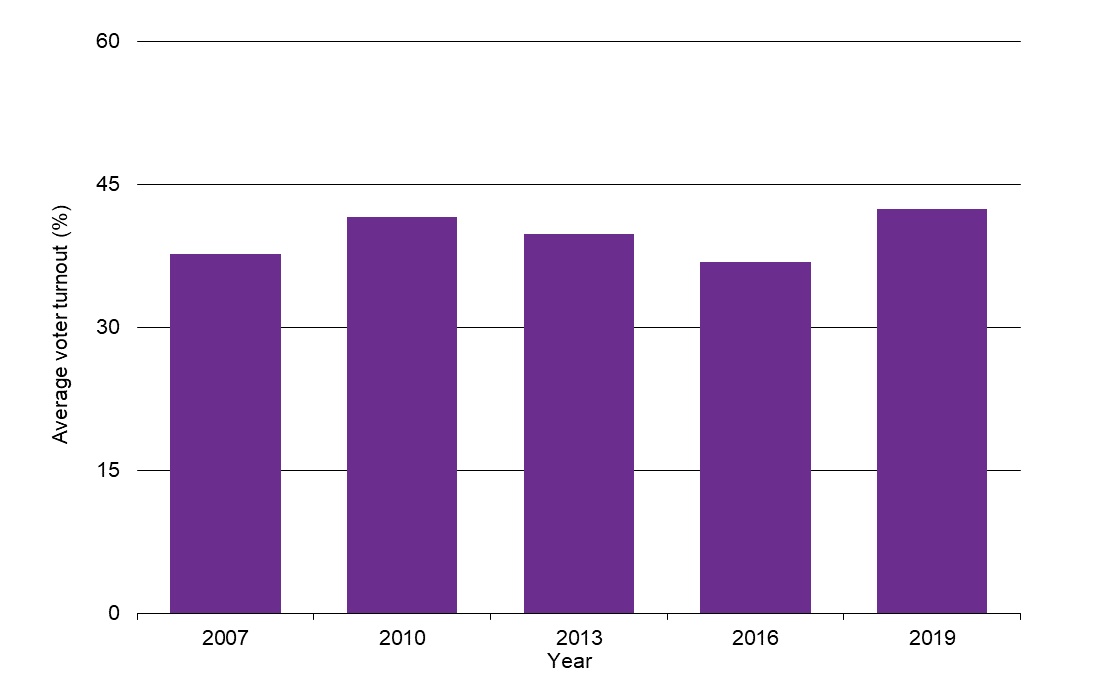
| Year | Average voter turnout in local council, DHB and regional council elections (%) |
|---|---|
| 2007 | 37.6 |
| 2010 | 41.5 |
| 2013 | 39.7 |
| 2016 | 36.9 |
| 2019 | 42.4 |
What is this indicator telling us?
- The Department of Internal Affairs is in the process of releasing the voter turnout statistics from the 2022 local government elections.
- According to indicative figures, voter turnout in local authority elections in the Waikato Region in 2022 was highest in Thames-Coromandel District (52%) and lowest in Hamilton City (29%). The indicative Regional Council voter turnout was around 39% (pending confirmation from official release).
- Average voter turnout of 42% for the 2019 local council, WDHB and regional council elections was above the 2007 baseline of 38%. (Note: there was no WDHB election in 2019 so the DHB result was imputed from 2016 to 2019 growth rates for local council and regional council elections).
- Average voter turnout in the Waikato region in 2019 was similar to the national average of 43%.
- Voter turnout in smaller district councils tends to be higher than for regional and city councils, and factors such as population age, wealth and home ownership rates also influence voting behaviour. In the 2019 local council elections, the highest levels of voter turnout throughout the Waikato region were in the Thames-Coromandel district (55%) and Taupō district (54%) and lowest were for the Waikato District (35%), South Waikato District (37%), Waipā District (38%) and Hamilton city (39%). Voter turnout for Waikato Regional Council was 44%.
- Voter turnout in local authority elections has been trending generally downward since 1989, following the restructuring of local government. Although there were increased voter turnout rates for many councils in 2019 compared to other elections since 2007, turnout remained well below the levels of the 1990s and prior. Similar trends are evident for WDHB and regional council elections.
- Voter turnout for national general elections tends to be higher than local or regional elections but following a similar pattern over time. In 2020, the New Zealand general election had 82% voter turnout. While this was substantially higher than recent years, such as the 2011 record-low turnout of 74%, it remains below historical levels, for example 88% turnout in 1996.
- New Zealand’s level of voter turnout for the 2020 general elections remains higher than the Organisation for Economic Co-operation and Development (OECD) average of 68%.
DATA SOURCE AND SUPPORTING INFORMATION
The Department of Internal Affairs is in the process of releasing the voter turnout statistics from the 2022 local government elections. Indicative figures for territorial local authorities are available for download on the votelocal website. Final figures cannot be confirmed until the official data release.
Local authority election statistics can be downloaded from the Department of Internal Affairs website.
WPI average voter turnout in local council, DHB and regional council elections (%) is calculated by dividing total electors by total voters. Regional comparators for average voter turnout are calculated from data for the regional councils, local councils and DHBs within each respective region.
Waikato DHB did not hold an election in 2019 because the Minister had appointed a commissioner. For calculating 2019 WPI average voter turnout figure, the Waikato DHB election result is therefore imputed from the 2016 to 2019 average growth rate for local and regional council elections.
According to DIA (2010) page 38: “A range of factors impact on voter turnout at local authority elections in New Zealand. The level of turnout at a particular election can be seen to reflect a combination of underlying factors and particular local issues relating to that election. Underlying factors are the ongoing institutional arrangements relating to local elections, the characteristics of the particular electorate in terms of such things as size and its urban/rural character, and also the vicissitudes of elector behaviour.”
Because size of constituency is a key determinant of voter turnout, TA rates (or averages) cannot be meaningfully compared with regional council turnout rates. For this reason, and for consistency with the Wellington Region Genuine Progress Index, the Waikato Progress Indicator (WPI) primary indicator has been selected as being the average voter turnout in local council, DHB and regional council elections.
Further insights are available in LGNZ’s Elections Fact Sheet 2019.
New Zealand general election data are sourced from the Electoral Commission.
Update details: Indicator is the average voter turnout in local council, WDHB and regional council which occur triennially. Local authority elections are held on the second Saturday in October every three years. The most recent local authority election was 8 October 2019.
Customised data request requirements: Generally nil, as the required statistics are regularly published through tables in the Department of Internal Affairs (DIA) Local Authority Election Statistics report. However, if WPI publication is within several months following an election and/or if the DIA report discontinues publication of the WPI-specific required data, then it should be possible to get a customised data extract directly from DIA. The WPI information to be sought is voter turnout for local council, DHB and regional council elections – Waikato region, Auckland, Wellington region, Bay of Plenty and total New Zealand regional councils’ average. Secondary data may also be useful in relation to territorial authority (TA) elections and also voter turnout for mayoral elections.
Note this WPI indicator is harmonised with the Wellington Region Genuine Progress Index (WRGPI) voter turnout indicator.
DATA AVAILABILITY – OTHER THAN WAIKATO REGION:
Territorial Authority (TA) disaggregation: Yes
Other regions: Yes
New Zealand: Yes
Other countries/ Organisation for Economic Co-operation and Development (OECD): OECD comparison available from the Better Life Index website

To ask for help or report a problem, contact us
Tell us how we can improve the information on this page. (optional)