Transport to work
Why we monitor transport to work
The way people travel to work provides a useful way of monitoring the general travel characteristics within the Waikato region. It can indicate changes in journey patterns and highlight any needs for further research or changes required for the region’s transport systems.
We use Journey to Work data from the Census in our Regional Land Transport Strategy.
This indicator is a measure of travel and transport behaviour in the region. It provides information on the usage of different ways of travelling to work. The data help us monitor changes in travel patterns and to plan transport services.
Results - data and trends
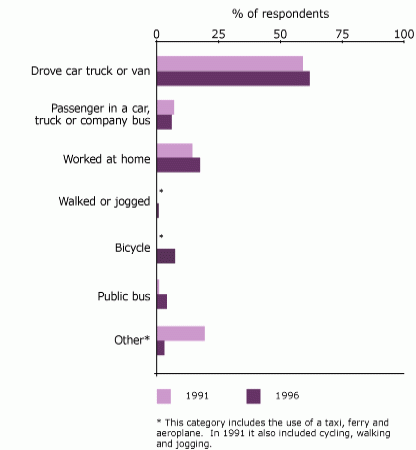
The most common way of getting to work in the Waikato region is to drive a motor vehicle to work. More than half of the people in our region drove themselves to work on Census Day in 1991 and 1996. Driving to work is one of the least environmentally friendly ways of travelling to work.
The use of some more environmentally friendly transport modes is increasing. Four per cent of people used public transport to get to work in 1996, up from just one per cent in 1991. Statistics New Zealand amalgamated the ‘walked or jogged’ and ‘bicycle’ categories with the ‘other’ category for the 1991 data, so we cannot tell if there has been any change in these two transport modes.
Our region’s figures are very similar to the national averages for how people travel to work. However, there are more people working at home in our region. In 1996, 17.4 per cent of people in our region worked from home, the national average was 11.2 per cent.
The graph shows the main types of transport people in the Waikato region used to get to work on Census Day in 1991 and 1996.

The data file spreadsheet contains the source data to this indicator's graph and any additional data. The census data were collected in the 1991 and 1996.
Methods - how we monitor
More information
When this indicator is updated
This indicator is under review
Footnotes
1. Copyright: Information obtained from Statistics New Zealand may be freely used, reproduced, or quoted unless otherwise specified. In all cases Statistics New Zealand must be acknowledged as the source.


To ask for help or report a problem, contact us
Tell us how we can improve the information on this page. (optional)