Employment

 EMPLOYMENT
| NO SIGNIFICANT CHANGE |
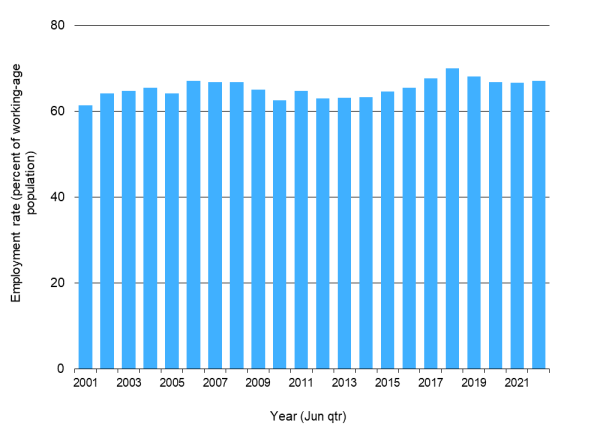
The employment rate in June 2022 was around the same level as the WPI 2006-07 baseline period.
This indicator is the percentage of working age people in the Waikato region who are employed.
Why is this indicator important?
The employment rate (and by association, the unemployment rate) indicate how much paid employment is available within an area. These rates are affected by several factors, including economic conditions and the availability of work, migration flows, skill levels, family responsibilities and personal decisions.
Paid employment is a major factor determining people’s personal income, which in turn determines people’s ability to purchase goods and services. It also affects health, housing, education and crime outcomes. People often define themselves by their employment status, so employment is linked to their ability to participate and have a sense of belonging in their community. Overall, it contributes to the standard of living people and their families have access to and thus their quality of life.
Employment

| Year (Jun qtr) | Employment rate (percent of working-age population) |
| 2001 | 61.4 |
| 2002 | 64.1 |
| 2003 | 64.8 |
| 2004 | 65.4 |
| 2005 | 64.1 |
| 2006 | 67.1 |
| 2007 | 66.7 |
| 2008 | 66.7 |
| 2009 | 65.0 |
| 2010 | 62.6 |
| 2011 | 64.7 |
| 2012 | 63.0 |
| 2013 | 63.1 |
| 2014 | 63.2 |
| 2015 | 64.6 |
| 2016 | 65.4 |
| 2017 | 67.7 |
| 2018 | 70.0 |
| 2019 | 68.1 |
| 2020 | 66.7 |
| 2021 | 66.6 |
| 2022 | 67.1 |
What is this indicator telling us?
- Employment rate trends in the Waikato region tend to reflect national trends. The regional employment rate has weathered both a global financial crisis and a pandemic over the past decade and a half and remains around the same level as it was in 2006-07.
- Mirroring this, the regional unemployment rate in June 2022 remained low at 3.5%. One of the reasons unemployment has stayed so low is that the labour force participation rate fell from 2018 highs to more ‘normal’ levels which implies people have left the workforce.
- In addition to the unemployment rate, the labour underutilisation rate also provides a useful indicator. Labour underutilisation reflects the total number of people in the labour force who are not being fully utilised, as well as some who are outside of the labour force who can be considered ‘potential labour supply’. According to Household Labour Force Survey data, the labour underutilisation rate in the Waikato Region was at a relatively low rate of 8.9% in the June 2022 quarter, similar to the New Zealand rate of 9.0%.
- Separate from the Household Labour Force Survey measures, Ministry of Social Development quarterly counts of Jobseeker Work Ready Support recipients show that as at the June 2022 quarter, 11,250 people in the Waikato region were receiving Jobseeker Work Ready Support, approximately 2,500 more than June 2019. The number of Jobseeker Support recipients increased substantially due to the COVID-19 pandemic and is now slowly reducing.
- As at June 2022, New Zealand’s employment rate was approximately 10 percentage points above the Organisation for Economic Co-operation and Development (OECD) average and amongst the highest in the world.
DATA SOURCE AND SUPPORTING INFORMATION
Labour market statistics, including Household Labour Force Survey (HLFS) data are available from Statistics New Zealand (SNZ) through Infoshare. Relevant figures are from Work, income and spending > Household Labour Force Survey – HLF > Labour Force Status by Sex by Regional Council (Qrtly-Mar/Jun/Sep/Dec).
MSD Jobseeker Support quarterly data is available at www.msd.govt.nz/about-msd-and-our-work/publications-resources/statistics/benefit/index.html
Update details: Quarterly rates available from the HLFS, published online by SNZ within 5-6 weeks following the end of the quarter.
Customised data request requirements: Nil
DATA AVAILABILITY – OTHER THAN WAIKATO REGION:
Territorial Authority (TA) disaggregation: No
Other regions: Yes
New Zealand: Yes
Other countries/ Organisation for Economic Co-operation and Development (OECD): Most recent OECD comparative figures are available online.


To ask for help or report a problem, contact us
Tell us how we can improve the information on this page. (optional)