

Residential expansion onto highly productive land

 RESIDENTIAL EXPANSION ONTO HIGHLY PRODUCTIVE LAND
| WORSENING TREND |
Data indicate that the area of urban and rural residential use on highly productive land in the Waikato region has been increasing since 2002.
This indicator is based on the area (ha, hectares) of highly productive land in urban and rural residential use in the Waikato region at four timesteps (2002, 2008, 2012 and 2019). The source of the data is Manaaki Whenua – Landcare Research. Highly productive land is classified using the ‘Land Use Capability’ (LUC) system, as LUC classes 1–3 (Lynn et al., 2009). This land is a finite and scarce resource, occupying less than 15% of New Zealand’s land area (Carrick et al., 2020).
Why is this indicator important?
The expansion of urban and rural residential use generally results in a reduction in land available for primary production. The loss of land, particularly the most highly productive land (i.e. Land Use Capability classes 1-3) available for primary production, may have various economic, environmental, and social impacts including:
- A decrease in the primary productive capacity of the region’s economy due to less land suitable for productive uses being available.
- Environmental impacts associated with primary productive land uses being displaced onto less highly productive land where requirements for management inputs (e.g. fertilisers) and environmental risks (e.g. soil erosion on steeper land) are greater.
- Higher costs of production and distribution, due to productive uses (e.g. vegetable production) displaced onto land further away from major population centres, leading to higher food or commodity prices.
- Increased incidence of sensitivity to neighbouring rural land use activities (e.g. noise, odours, dust).
Monitoring urban and rural residential expansion onto highly productive land provides information for councils, land developers, and communities about which areas in the region are experiencing increasing pressures through urbanisation or peri-urban growth. This can help councils manage rates of residential expansion onto highly productive land through policies and plans.
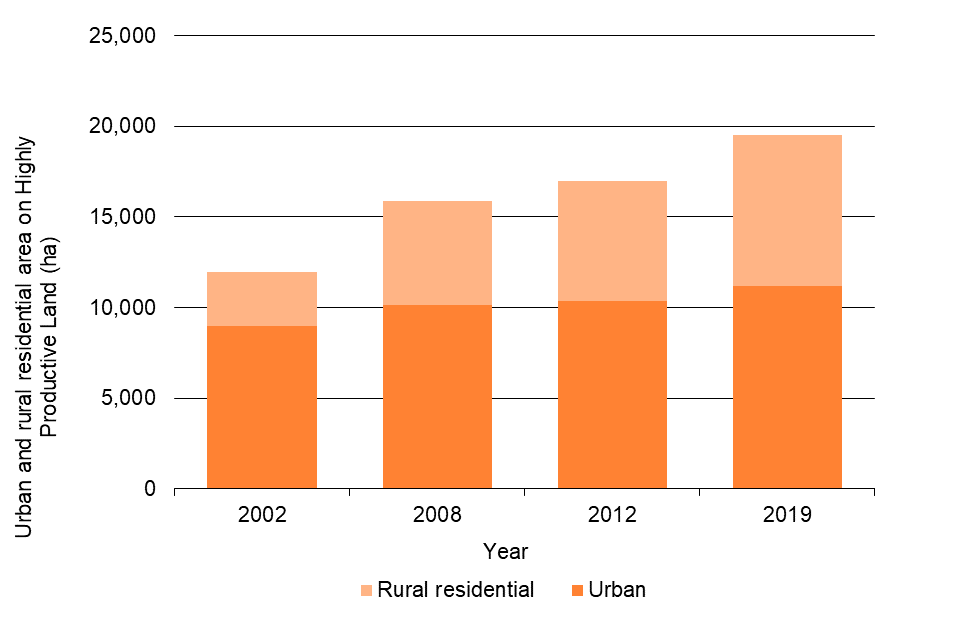
| Year | Urban area (ha) on highly productive land | Rural residential area (ha) on highly productive land | Total urban and rural residential area (ha) on highly productive land |
| 2002 | 8,973 | 3,003 | 11,976 |
| 2008 | 10,138 | 5,724 | 15,862 |
| 2012 | 10,364 | 6,611 | 16,975 |
| 2019 | 11,187 | 8,323 | 19,510 |
What is this indicator telling us?
- Urban and rural residential expansion onto highly productive land has been increasing over the four timesteps noted above. Between 2002 and 2019, the area of total urban and rural residential use on highly productive land increased by more than 60%, with an average increase of around 440 ha per year – an area equivalent to approximately four average-sized dairy farms in the Waikato region.
- Between 2002 and 2019, rural residential expansion accounted for most of the total urban and rural residential expansion onto highly productive land, with the rate of rural residential expansion (average increase of around 310 ha per year) considerably greater than the rate of urban expansion (130 per year).
DATA SOURCE AND SUPPORTING INFORMATION
Urban and rural residential expansion onto highly productive land refers to the change in area of highly productive land in urban and rural residential use. Land Use Capability classes 1-4 define highly productive land. Urban area is defined to be land parcels of 0.00-0.40 ha in size with a dwelling whereas rural residential area is defined to be land parcels 0.41-2.00 ha in size with a dwelling.
The source of these data is Manaaki Whenua – Landcare Research. The technical methods used for the derivation of these data is described by Carrick et al. (2020). Total change in area over the 17-year period (2002-2019) was averaged to give an indication of average annual change.
Update details: To be confirmed.
Customised data request requirements: Contact Waikato Regional Council Spatial Analyst for residential expansion onto highly productive land data.
REFERENCES
Carrick, S., Drewry, J., Barnes, M., Barringer, J., Price, R., Ausseil, A-G., Jones, H., Borman, D., 2020. Land fragmentation environmental reporting indicator – technical methods for analysis from 2002 to 2019. Manaaki Whenua – Landcare Research Contract Report: LC3846.
Lynn I.H., Manderson A.K., Page M.J., Harmsworth G.R., Eyles, G.O., Douglas G.B., Mackay, A.D., Newsome P.J.F., 2009. Land Use Capability Survey Handbook – a New Zealand handbook for the classification of land 3rd ed. Hamilton, AgResearch; Lincoln, Landcare Research; Lower Hutt, GNS Science. 163p.
DATA AVAILABILITY – OTHER THAN WAIKATO REGION:
Territorial Authority (TA) disaggregation: No
Other regions: No
New Zealand: No
Other countries/ Organisation for Economic Co-operation and Development (OECD): No

To ask for help or report a problem, contact us
Tell us how we can improve the information on this page. (optional)