

Road safety

 ROAD SAFETY
| IMPROVING TREND |
The annual social cost of fatal and injury road crashes per person in the Waikato region has fallen considerably since the 2007 baseline year.
This indicator is the estimated annual social costs of fatal and injury crashes per person in the Waikato region.
Why is this indicator important?
The rate of injury or death from motor vehicle accidents is a concern for motorists, pedestrians, cyclists and other road users. Examining the number and social cost of fatalities and serious injuries occurring each year in this region helps us to assess risks and find ways to reduce the harm these incidents cause to people. Higher crash rates on our region’s roads also puts increased pressure on support systems and other resources such as healthcare or financial assistance for those who are unable to work due to injury.
Road safety
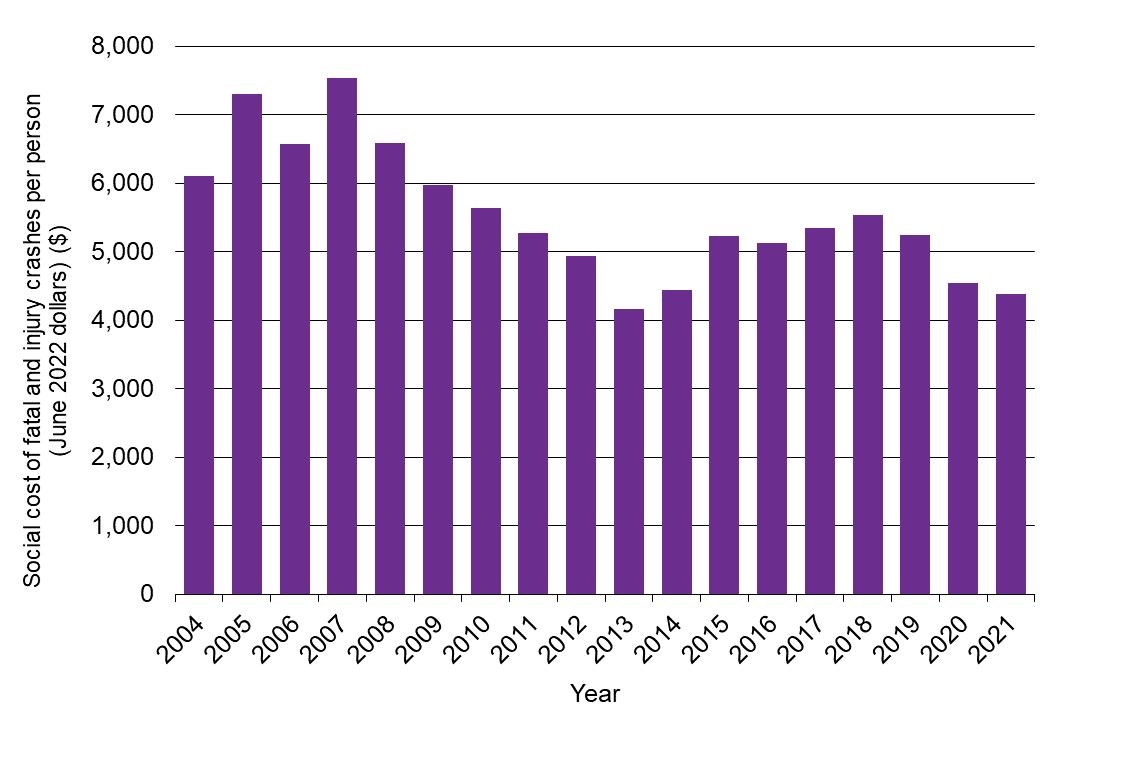
| Year | Social cost of fatal and injury crashes per person (June 2022 dollars ($)) |
| 2004 | 6,104 |
| 2005 | 7,296 |
| 2006 | 6,564 |
| 2007 | 7,531 |
| 2008 | 6,591 |
| 2009 | 5,979 |
| 2010 | 5,630 |
| 2011 | 5,279 |
| 2012 | 4,937 |
| 2013 | 4,162 |
| 2014 | 4,440 |
| 2015 | 5,232 |
| 2016 | 5,121 |
| 2017 | 5,340 |
| 2018 | 5,528 |
| 2019 | 5,236 |
| 2020 | 4,539 |
| 2021 | 4,376 |
What is this indicator telling us?
- Over the period 2007 to 2013, despite population growth, there was a declining rate of fatal and injury road crashes in the Waikato region and hence a reduced social cost per person. This trend was reversed over the period 2014 to 2018 but subsequently declined again. The social cost of road injury crashes is well below its 2007 peak.
- Nationally, there has been a long-term decline in the rate of road fatalities since 1990 due to improvements in vehicle safety, relatively fewer motorcycles and investment in more and better roads, along with road safety advertising, breath testing and lower speeds.
- The frequency and severity of road injury crashes in the Waikato region remains high compared to, for example, Wellington and Auckland. This is at least partly due to the rural nature of the region and major highways crossing the region.
- According to Ministry of Transport (MoT) crash data and Statistics New Zealand population estimates, the number of road deaths per annum in the Waikato region decreased from 107 in 2000 to 73 in 2022, equivalent to a decrease from 2.9 to 1.4 road deaths per 10,000 population.
- At a territorial authority level, the number of road crashes and casualties per year is a factor of the roading network characteristics, population density and other factors, while trends over time are underpinned by changes in travel patterns and driving conditions. Comparing the year 2000 to 2022, the annual number of road crashes of all types increased most rapidly in percentage terms in Thames-Coromandel (+82%) and South Waikato (+55%) and declined most rapidly in Hamilton (-30%).
DATA SOURCE AND SUPPORTING INFORMATION
The Ministry of Transport calculates the annual estimates of the ‘social cost’ of road crashes and injuries, which are based on loss of life and life quality, loss of output due to temporary incapacitation, medical costs, legal costs and vehicle damage costs. The estimates account for changes in the mix of crashes by area and severity; the average number of injuries received in a crash; any inflationary effects and any changes in the levels of non-reporting.
The loss of life component is estimated by the amount of money that the members of the New Zealand population would be willing to pay for a safety improvement which results in the expected avoidance of one premature death (i.e. willingness-to-pay method).
Regional time series in current prices are from a custom request to the Ministry of Transport. Secondary data on the average social cost of road crashes and injuries per region are also available in annual reports on the Ministry of Transport website. Note that the time series is retrospectively updated each year to account for revised crash and injury data as well as price rebasing.
From the 2023 WPI update, the social cost estimates are substantially higher than in previous updates. This is because the largest component, the base Value of Statistical Life (VOSL) was completely redone in a study published in earlier 2023 (www.nzta.govt.nz/resources/research/reports/698). A VOSL of $12.5m (in 2021 prices) was adopted based on the midpoint of the results from that research. Prior to that it was $4.9m, which came from inflation-adjusting the original 1991 VOSL of $2m.
The regional real social cost data were divided by regional population estimates from Statistics New Zealand NZDot.Stat website (subnational (RC) population estimates at 30 June using 2022 RC boundaries), to arrive at real social cost per capita estimates. Note the time series may be retrospectively updated from time to time, for example following the New Zealand Census.
You can also read the Ministry of Transport’s Infometrics Ltd analysis report on long term New Zealand road toll trends.
Road crash and casualties data at the regional and territorial authority level are available at the NZTA’s Open data portal for download: https://opendata-nzta.opendata.arcgis.com/datasets/crash-analysis-system-cas-data-1. Create a pivot table to extract.
Update details: Annual social cost data are reported to 2021, with 2022 data expected to be available around March 2024.
Customised data request requirements: Ministry of Transport time series in latest dollar terms for the annual social cost of fatal and injury crashes for Auckland, Waikato, Bay of Plenty, Wellington and New Zealand. Note that publication of the social cost estimates requires Ministerial approval, hence this customised request can only be finalised once such approval has been granted.
DATA AVAILABILITY – OTHER THAN WAIKATO REGION:
Territorial Authority (TA) disaggregation: No
Other regions: Yes
New Zealand: Yes
Other countries/ Organisation for Economic Co-operation and Development (OECD): No

To ask for help or report a problem, contact us
Tell us how we can improve the information on this page. (optional)