

WPI Scorecard

The Waikato Progress Indicators (WPI) measure our societal and environmental progress in the Waikato region, as well as growth in our regional economy.
This helps to identify which aspects we are doing well in, where we need to improve, and how changes in one aspect are linked with or affected by changes in others.
We also want to find out how we compare with other regions within New Zealand; nationally with average New Zealand; and internationally.
Progress and comparison at a glance
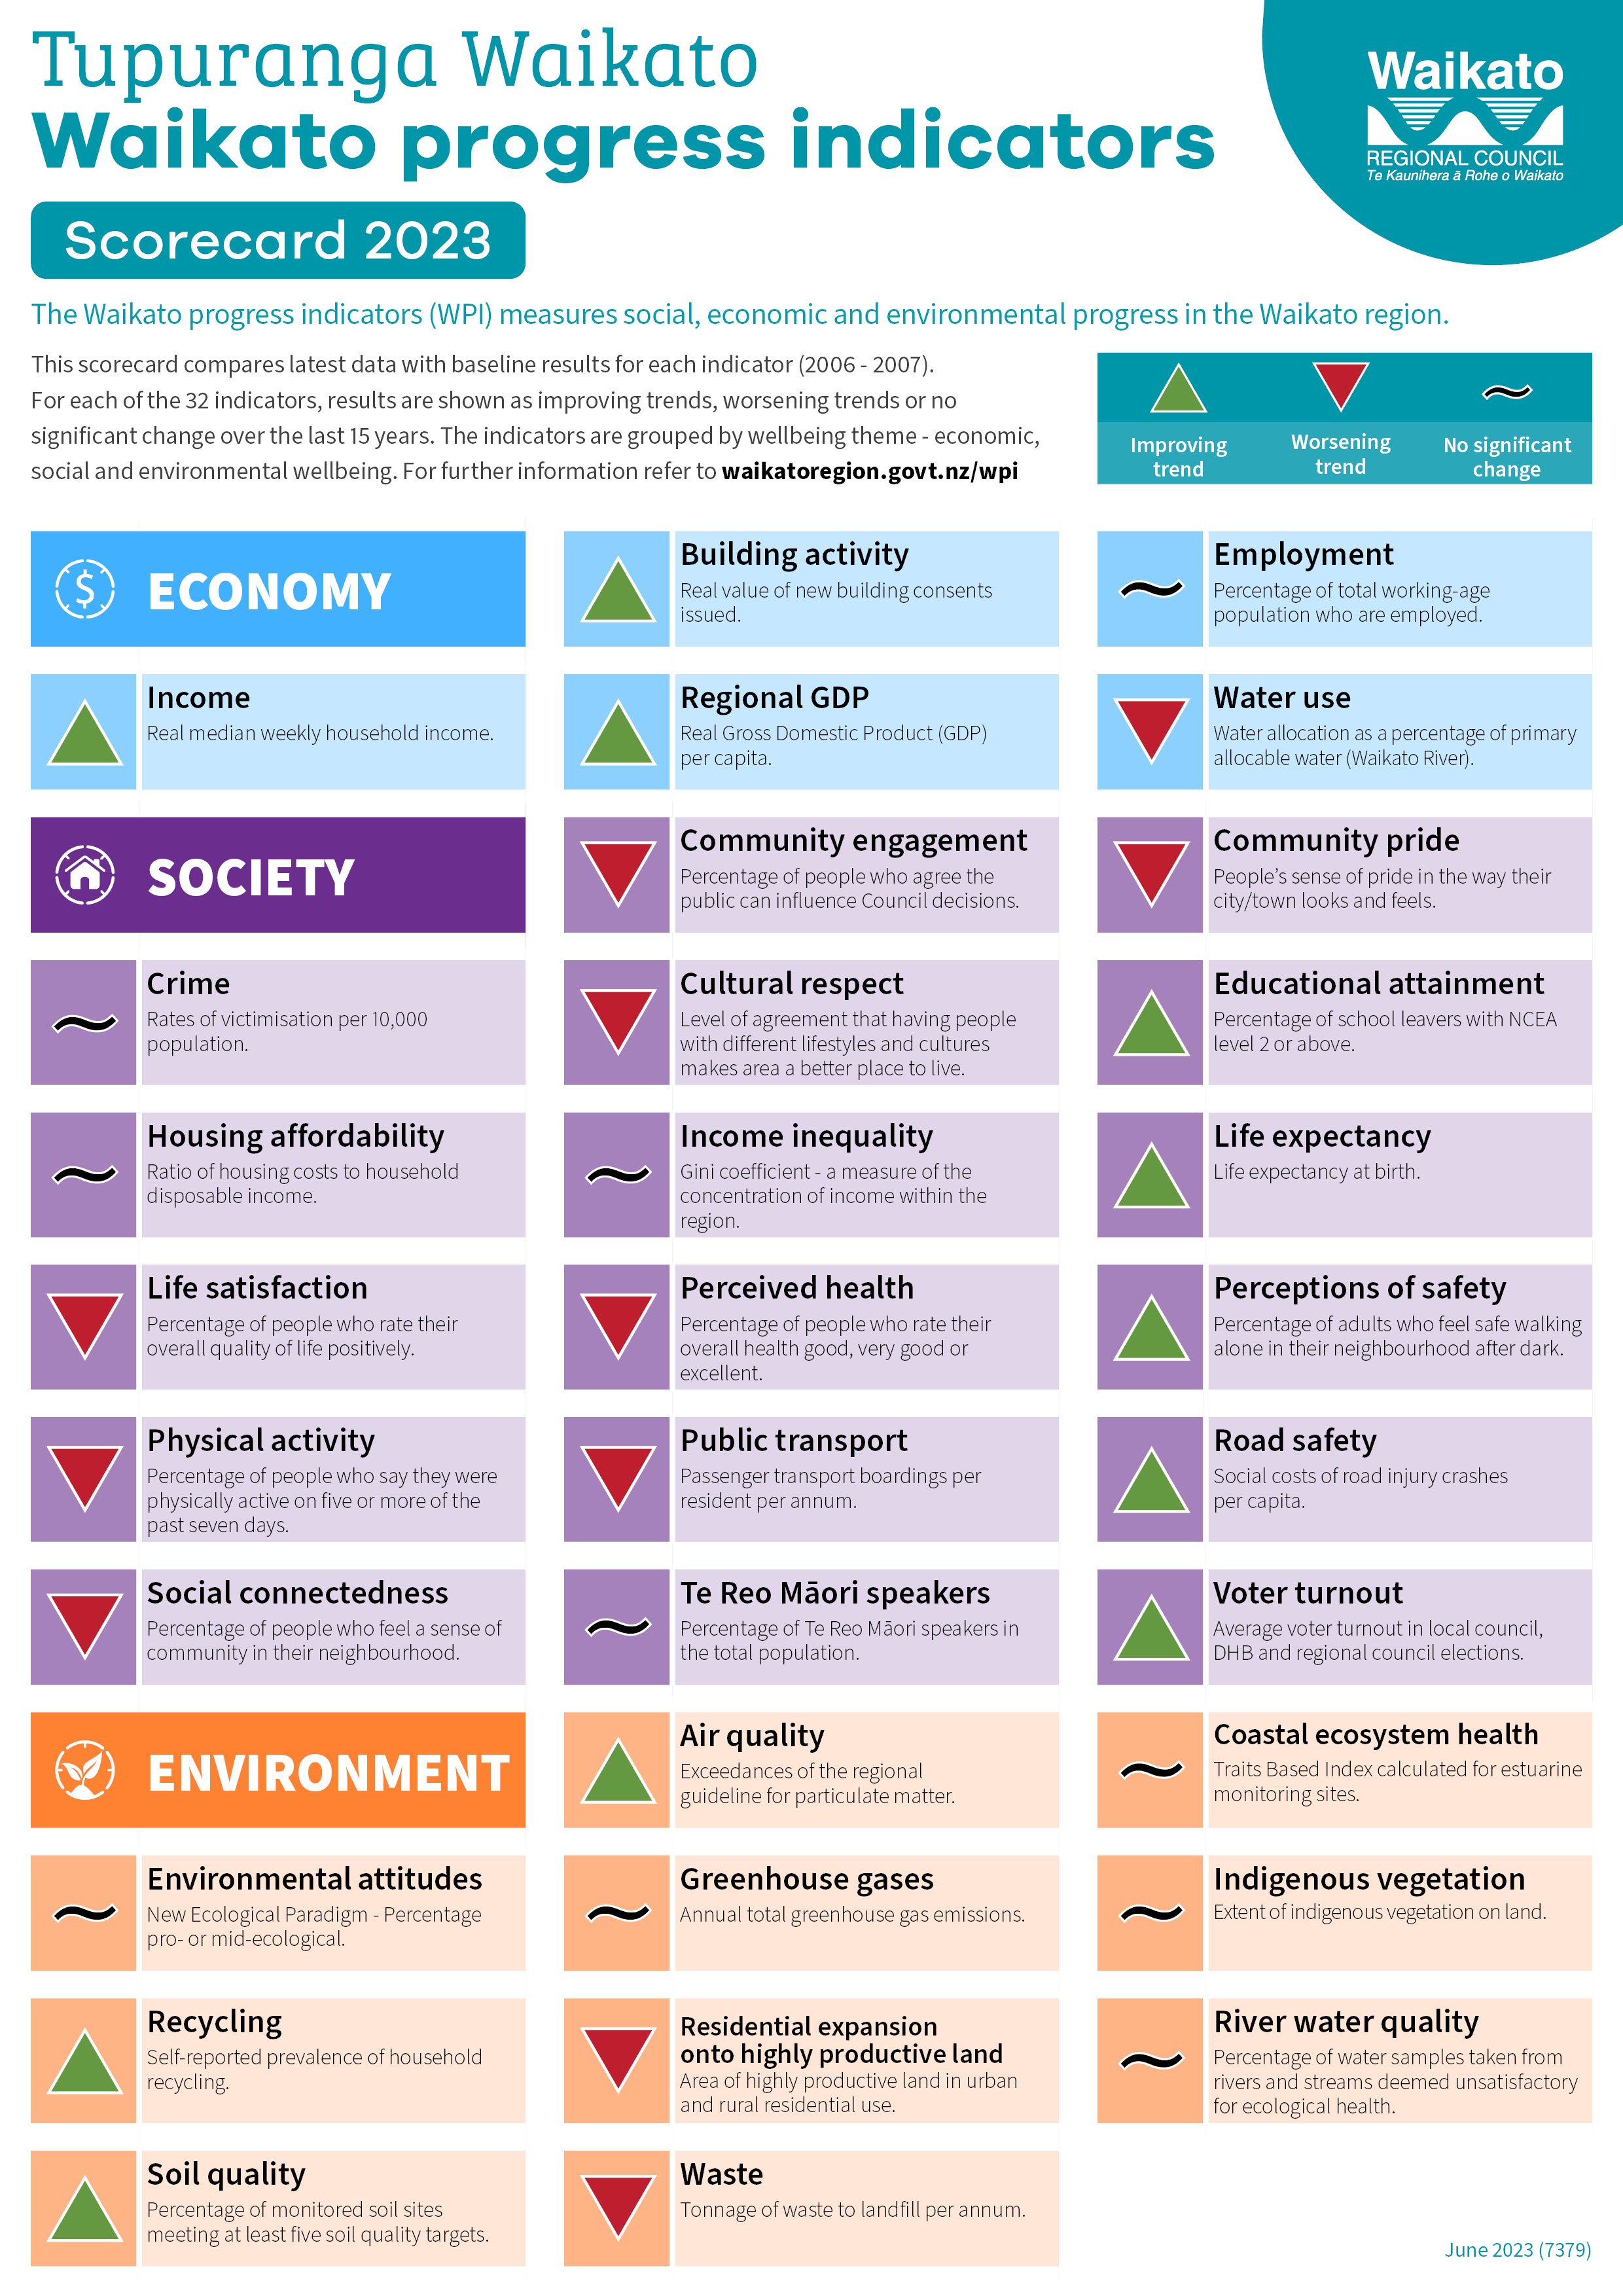 Scorecard
The WPI scorecard shows our region’s progress, displaying the improving or worsening trends for each of the 32 indicators. The indicators are grouped by wellbeing theme - economic, social, environmental.
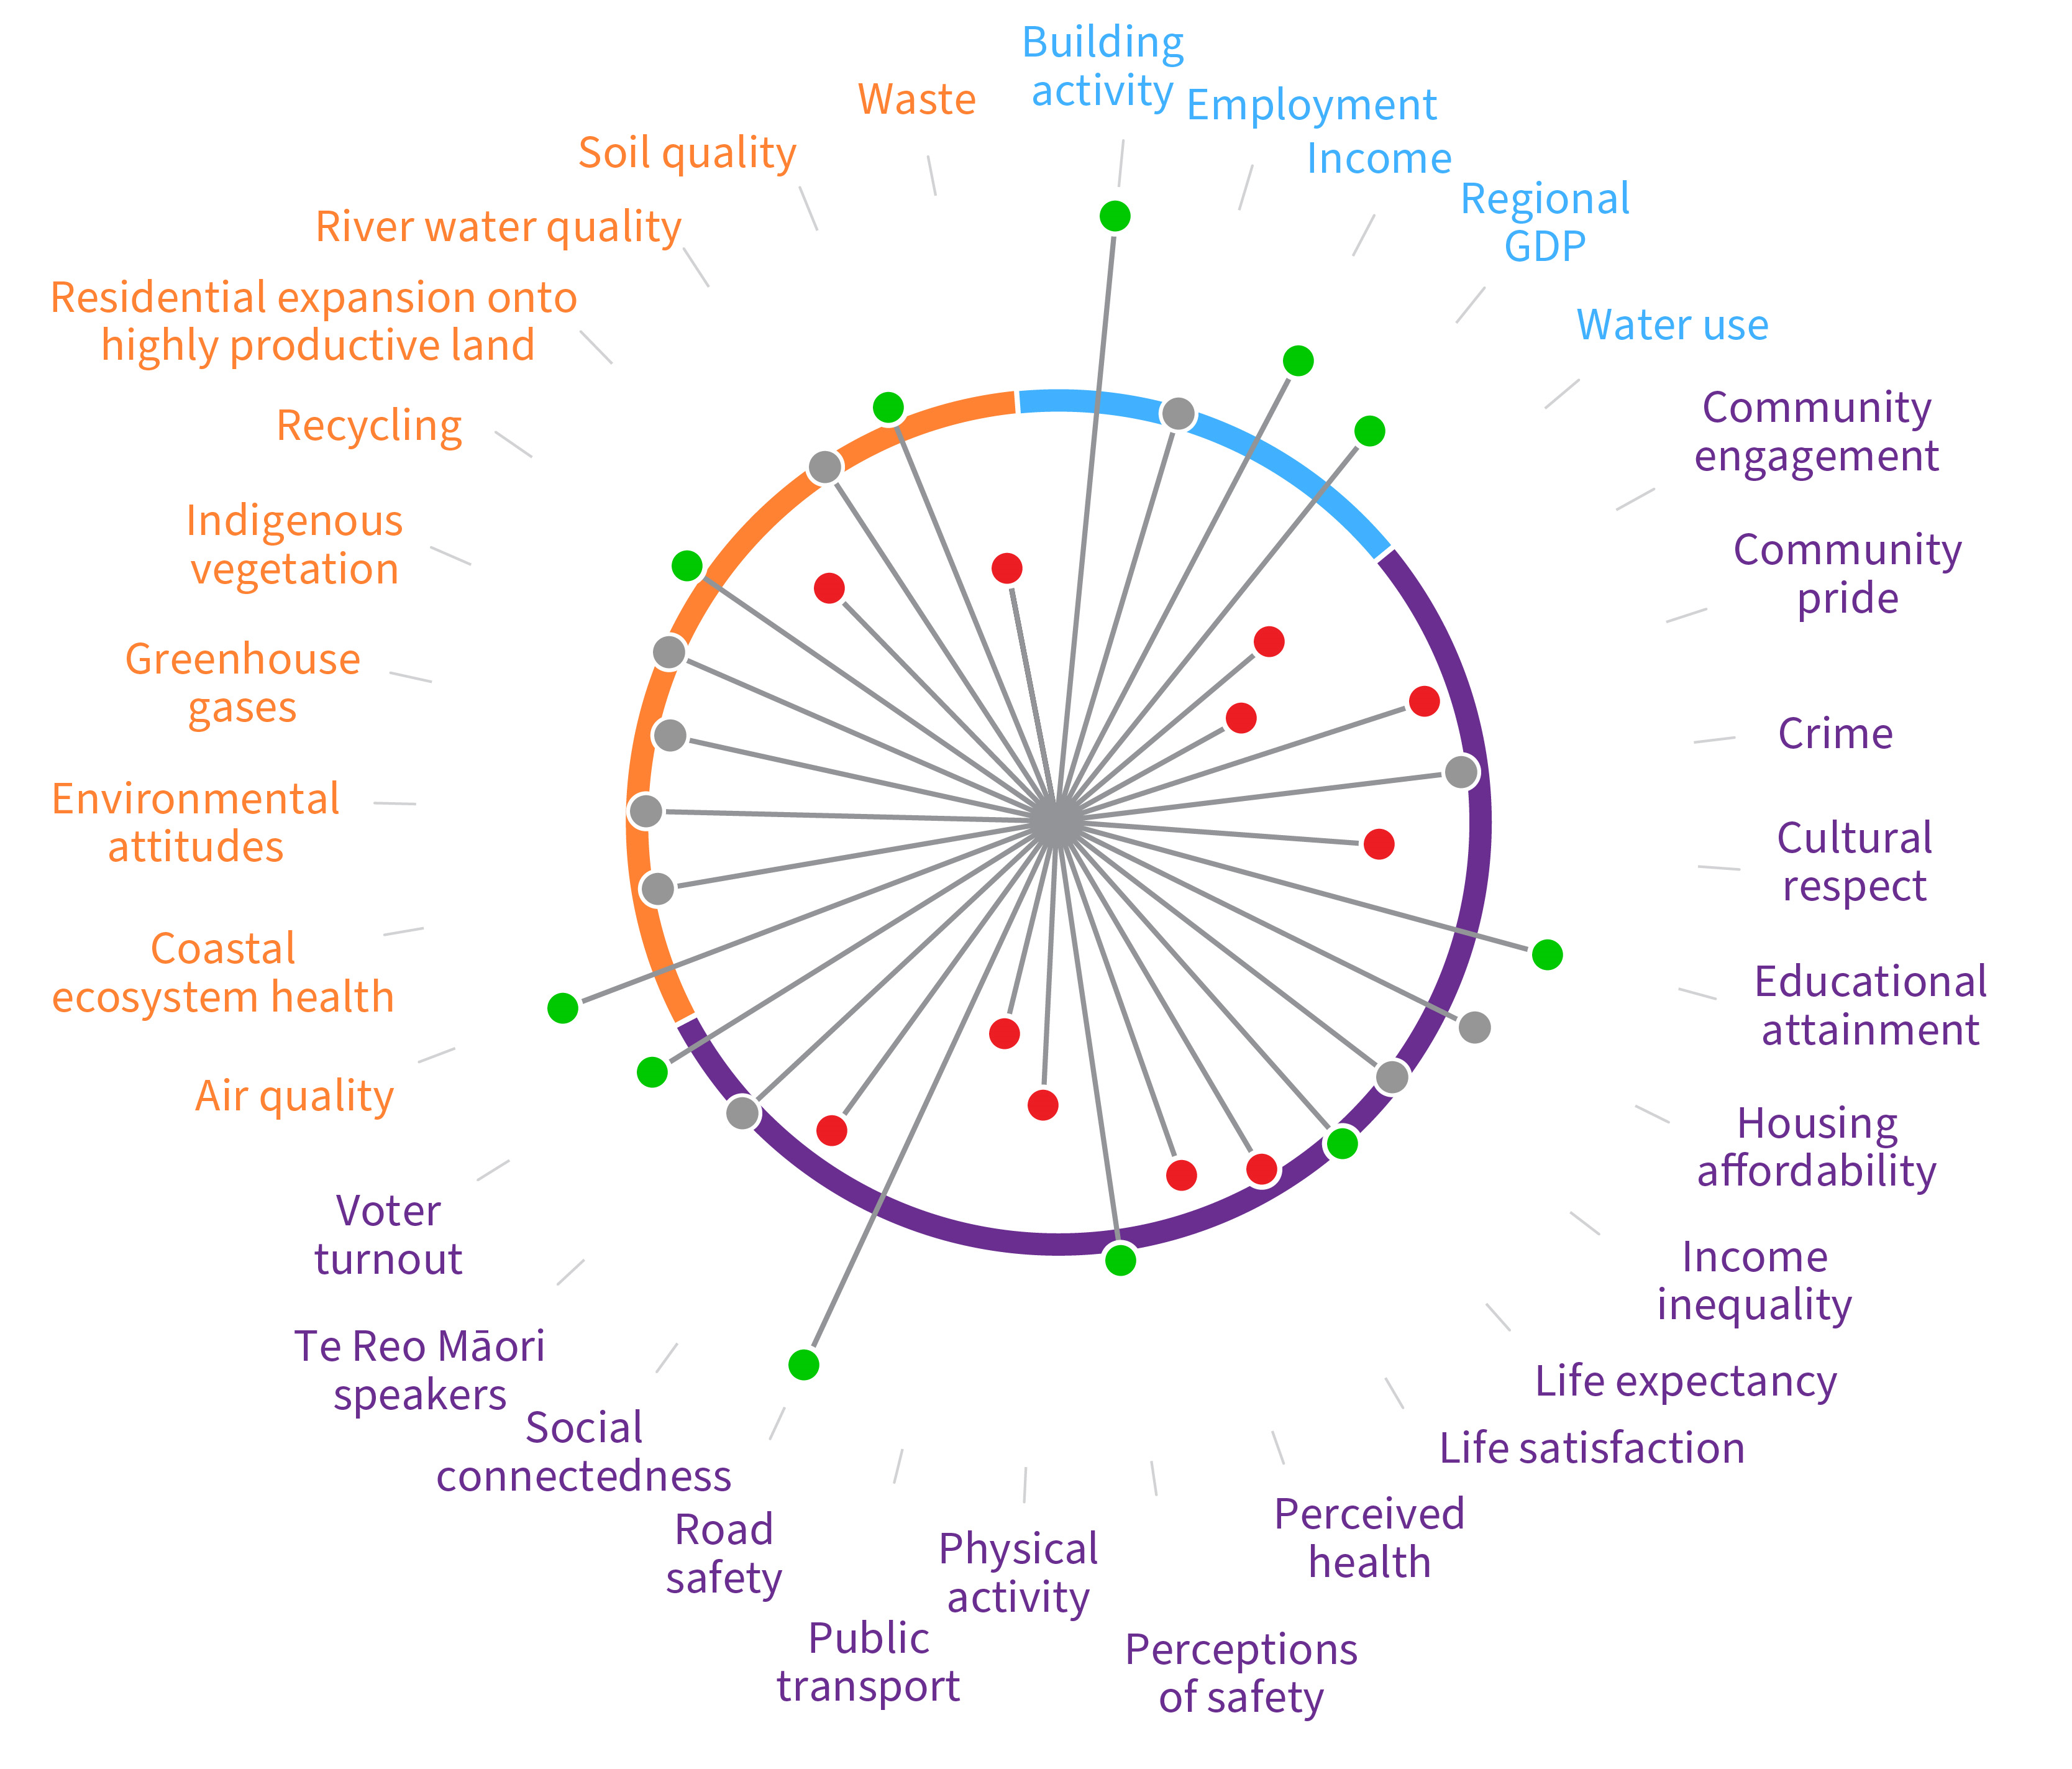 Circle of wellbeing - change over time
'Circles of wellbeing' combine several indicators into a circle diagram, showing differences in economic, environmental and social changes and progress over time. In the longer-term view, the first circle plots the overall change for the Waikato region for the period approximately 2006-07 to the latest available data for all WPI indicators. In the shorter-term view, the period is 2018 to latest available.
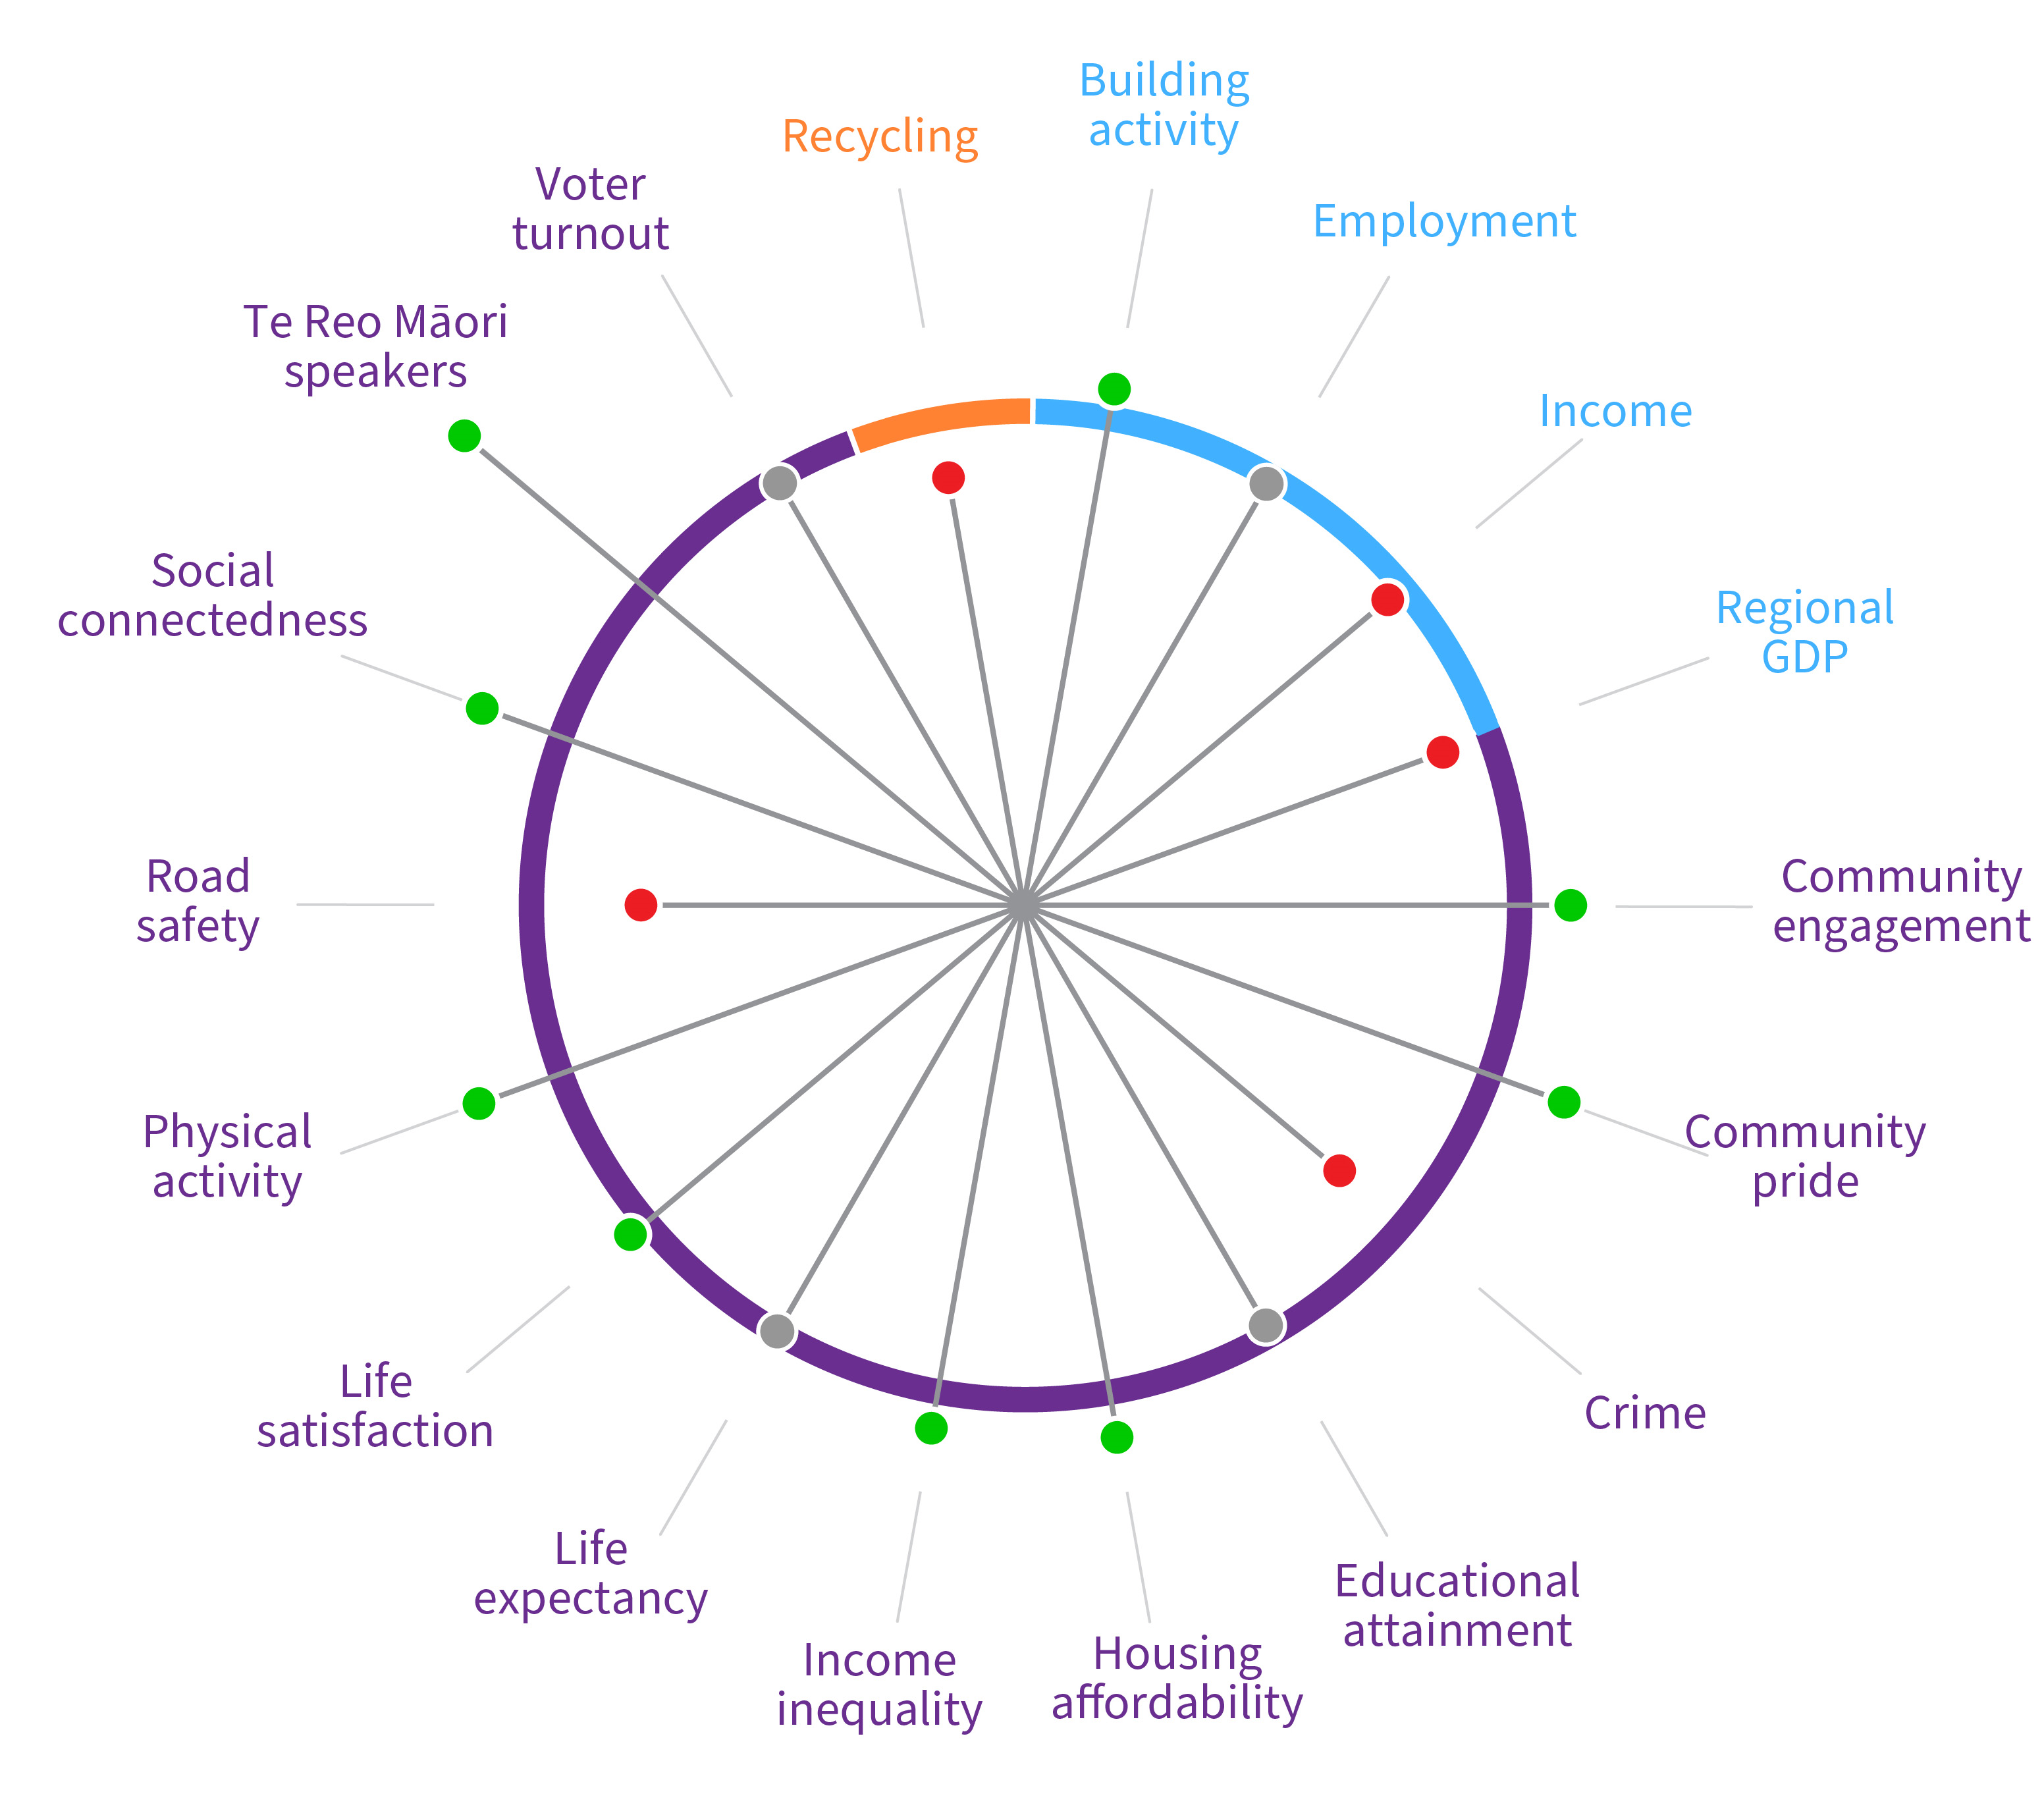 Circle of wellbeing - compare Waikato with New Zealand
This circle compares the state of selected WPI indicators for the Waikato region versus similar ones measured for New Zealand using latest available data.
Click on a link below to download a full-size PDF copy of the scorecard and/or circles of wellbeing.

Ongoing development
This information will be regularly updated as we continue to track our progress and identify trends in the future.
The Waikato Progress Indicators (WPI) monitoring programme covers the period 2001 to latest available data with a particular focus on the years since 2006/07, supplemented by information on shorter-term trends. Information from 2007 onwards is more robust and as the WPI monitoring programme continues it will provide an increasingly accurate signal of long term trends and regional progress over time.
More data are collated and tracked to support the 32 WPI indicators. This will provide a more complete picture of underlying drivers, causes and effects for the observed changes and trends to enable more targeted and effective interventions and policies.
Ongoing development includes alignment of wellbeing data and indicators with regional and national initiatives (e.g. Waikato Wellbeing Project, local government/Taituarā, Treasury and Statistics NZ) to assist the development of a Waikato wellbeing Knowledge Centre that adds meaning to the data, provides insights and knowledge, and explores local and distributional aspects (district, neighbourhoods, deprivation, ethnicity).

To ask for help or report a problem, contact us
Tell us how we can improve the information on this page. (optional)