

River water quality

 RIVER WATER QUALITY
| NO SIGNIFICANT CHANGE |
The average proportion of unsatisfactory river water samples for ecological water quality for the period 2018-2022 at over 100 monitoring sites throughout the Waikato region was largely unchanged from 2003-2007.
This indicator is the percentage of unsatisfactory river water samples for ecological water quality in the Waikato region’s rivers and streams, as an average across all sites measured. Results are presented as a five-year rolling average.
Why is this indicator important?
Monitoring a representative cross-section of rivers and streams across the Waikato region helps councils to assess the suitability of their water quality for native water plants and animals to live in (ecological water quality). Water quality not only affects the surrounding habitat; it can also impact elsewhere, because what happens in one area of the catchment can directly affect what happens in another. For example, soil erosion issues in the Waipa catchment can contribute to sedimentation in the Waikato River and flooding in the Lower Waikato. Contamination at one site in a river can flow to other sites further down the catchment.
Monitoring these sites helps councils to identify and manage issues so they can protect or improve water quality in these areas. Land use and what people do are two key areas influencing water quality. Sharing this information with people in the region can encourage them to consider the impact of their activities on water quality. They may also become motivated to work together with councils and other people in their community to keep the Waikato region’s water quality and its environment protected now and in the future.
Percent of unsatisfactory river water samples for ecological quality
| Period | Percent unsatisfactory |
| 2003-2007 | 29 |
| 2004-2008 | 29 |
| 2008-2012 | 29 |
| 2009-2013 | 29 |
| 2010-2014 | 28 |
| 2011-2015 | 28 |
| 2012-2016 | 28 |
| 2013-2017 | 28 |
| 2014-2018 | 29 |
| 2015-2019 | 29 |
| 2016-2020 | 29 |
| 2017-2021 | 29 |
| 2018-2022 | 29 |
Water quality trends in the Waikato River between 1993 and 2022
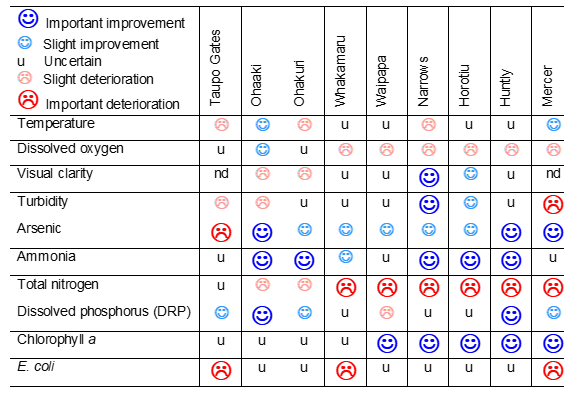
Source: Waikato Regional Council (using methods in Waikato Regional Council Technical Report 2018/30)
Note: Visual clarity, turbidity and arsenic are for the period since 1995, and E. coli is for the period since 1998.
nd, no data; Flow-adjusted data, n ≤ 360; LOWESS span 30%; Seasonal Kendall slope; Slope probability > 95%.
What is this indicator telling us?
- River water quality for ecological health is generally good across the region. However in areas where land use is more intensive, water quality for ecological health is poorer (for example, Hauraki and the lowland tributaries of the Waikato River). This is mainly because of the greater intensity of land use in the lowland parts of the Waikato region.
-
Water quality in the Waikato River is much better than it was in the 1950s. Urban and industrial wastewater treatment has improved considerably. But over the past twenty years, levels of nitrogen in the river have risen, probably as a result of land use changes over recent decades.
DATA SOURCE AND SUPPORTING INFORMATION
The Waikato Regional Council monitors more than 100 specific sampling water quality sites across the region. Council’s monitoring describes the average 'pass rate' for seven water quality measures: dissolved oxygen, pH; turbidity, ammonia, temperature, nitrogen and phosphorus. Water quality trends in the Waikato River use methods detailed in Waikato Regional Council Technical Report 2018/30.
Water quality data are reported online by Waikato Regional Council annually on the basis of five-year rolling average figures showing percentage of samples meeting guidelines for excellent, satisfactory or unsatisfactory river water quality across various groupings of monitoring sites (e.g. Lower Waikato River). For a variety of reasons it is not prudent to use annual comparisons of five-yearly rolling data (as in the previous MARCO method). Instead it was agreed for WPI reporting to use the five-year rolling average percentage of unsatisfactory samples (all sites) compared with a 2003-2007 baseline period.
Update details: Latest five-year rolling average (2018-2022) compared to baseline (2003-2007).
Customised data request requirements: Contact is Waikato Regional Council for the latest five-year rolling average percentage of unsatisfactory river water samples for ecological water quality in Waikato region rivers and streams (all sites average).
DATA AVAILABILITY – OTHER THAN WAIKATO REGION:
Territorial Authority (TA) disaggregation: No
Other regions: No
New Zealand: No
Other countries/ Organisation for Economic Co-operation and Development (OECD): No

To ask for help or report a problem, contact us
Tell us how we can improve the information on this page. (optional)