

River water quality for ecological health
Why we monitor river water quality for ecological health
 Waikato Regional Council routinely monitors a representative cross-section of regional rivers and streams to assess the suitability of water quality for native water plants and animals.
Sensitive aquatic plants and animals cannot live and thrive when water quality is poor.
Some contaminants (like ammonia and heavy metals) are toxic to aquatic organisms; others use up the dissolved oxygen that aquatic organisms need to breathe. Water that is too warm can stress sensitive fish and animals. Nuisance growths of water plants, algal slimes, and phytoplankton blooms can thrive when there are excessive levels of plant nutrients.
What's happening?
We monitor 115 sites on regional rivers and streams throughout the region. You can see more about those sites and their results, here.
An average ‘pass rate’ for seven water quality measures (dissolved oxygen, pH, turbidity, ammonia, temperature, nitrogen and phosphorus) is determined for each site by comparing sample results with national and local guidelines for ecological health.
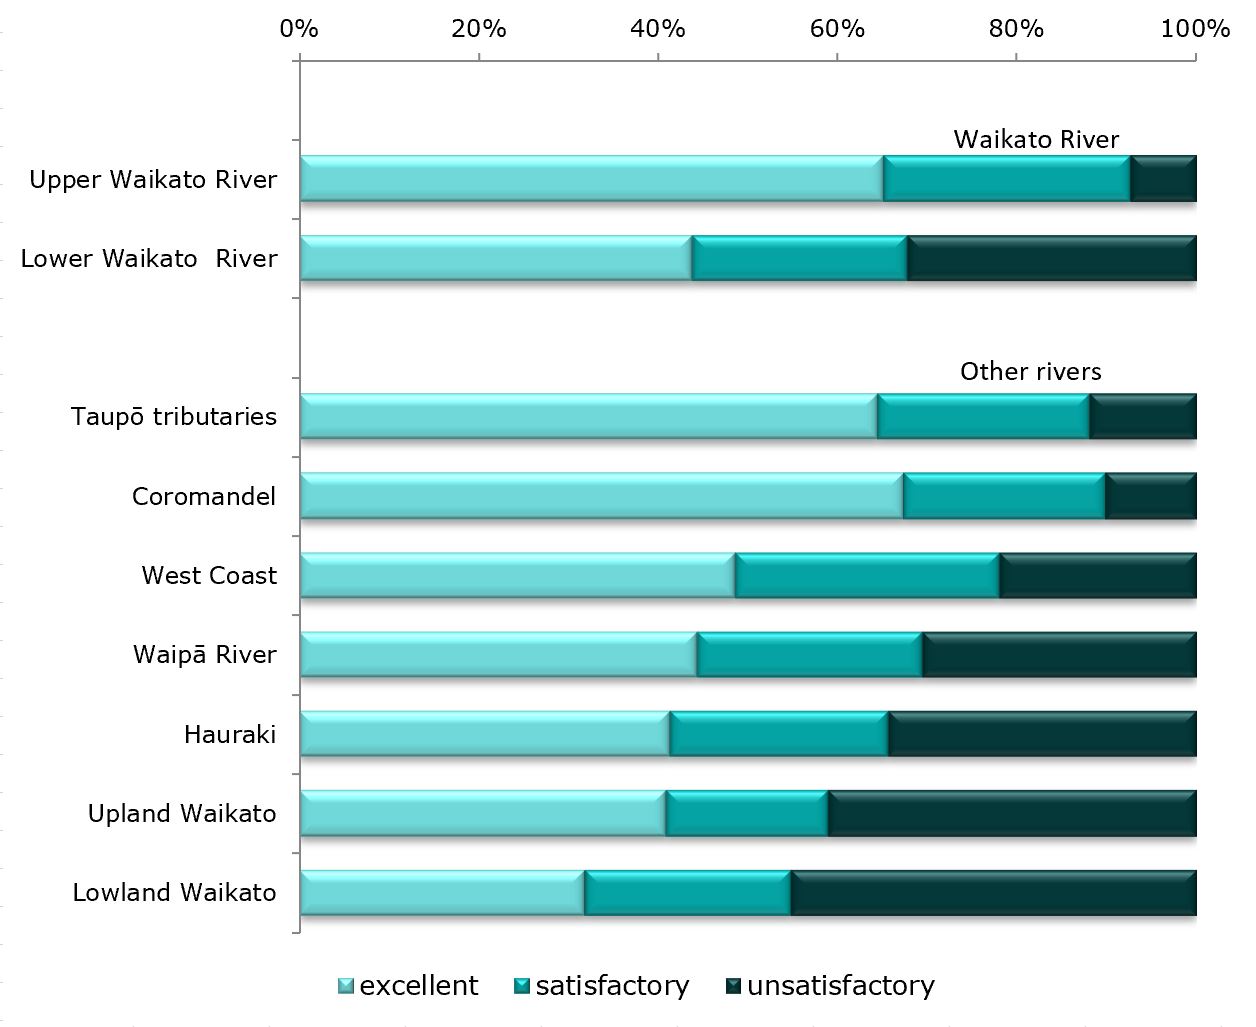
Water quality for ecological health is good in some parts of the region (for example, Upper Waikato River, tributaries of Lake Taupō and in the Coromandel). In the lowland areas water quality is not so good (for example, Hauraki, lowland tributaries of the Waikato River).
This largely reflects the greater intensity of land use in the lowland parts of the region, with higher levels of nitrogen and phosphorus, and highlights the importance of non-point sources of contamination such as runoff from agricultural land and urban areas.
We can assess the relative importance of various point and non-point sources of contamination using information from this indicator and Waikato Regional Council's resource consents database.
Methods - How we monitor
Results - data and trends
The Excel spreadsheet below contains the source data for this indicator's graph and information.
The graph shows the percent of samples from rivers around the region that met or exceeded our guidelines for excellent, satisfactory or unsatisfactory water quality for ecological health.
You can also see the individual monitoring results at each our monitored sites, here.
The data were collected from 2015-2019.
Percentage of samples meeting our guidelines for excellent, satisfactory or unsatisfactory river water quality for ecological health (2015-2019)

More information
When this indicator is updated
This indicator is updated annually.
Technical reports
Updated October 2021

To ask for help or report a problem, contact us
Tell us how we can improve the information on this page. (optional)