

Building activity

 BUILDING ACTIVITY
| |
IMPROVING TREND |
Building activity in the Waikato region remains at a high level.
This indicator is the real value of new building consents issued per capita per year within the Waikato region.
Why is this indicator important?
The value of building consents issued is seen as a leading indicator of economic activity. An increase in building consents is linked with an area’s economic growth, whereas a decrease indicates economic growth is declining.
Building activity
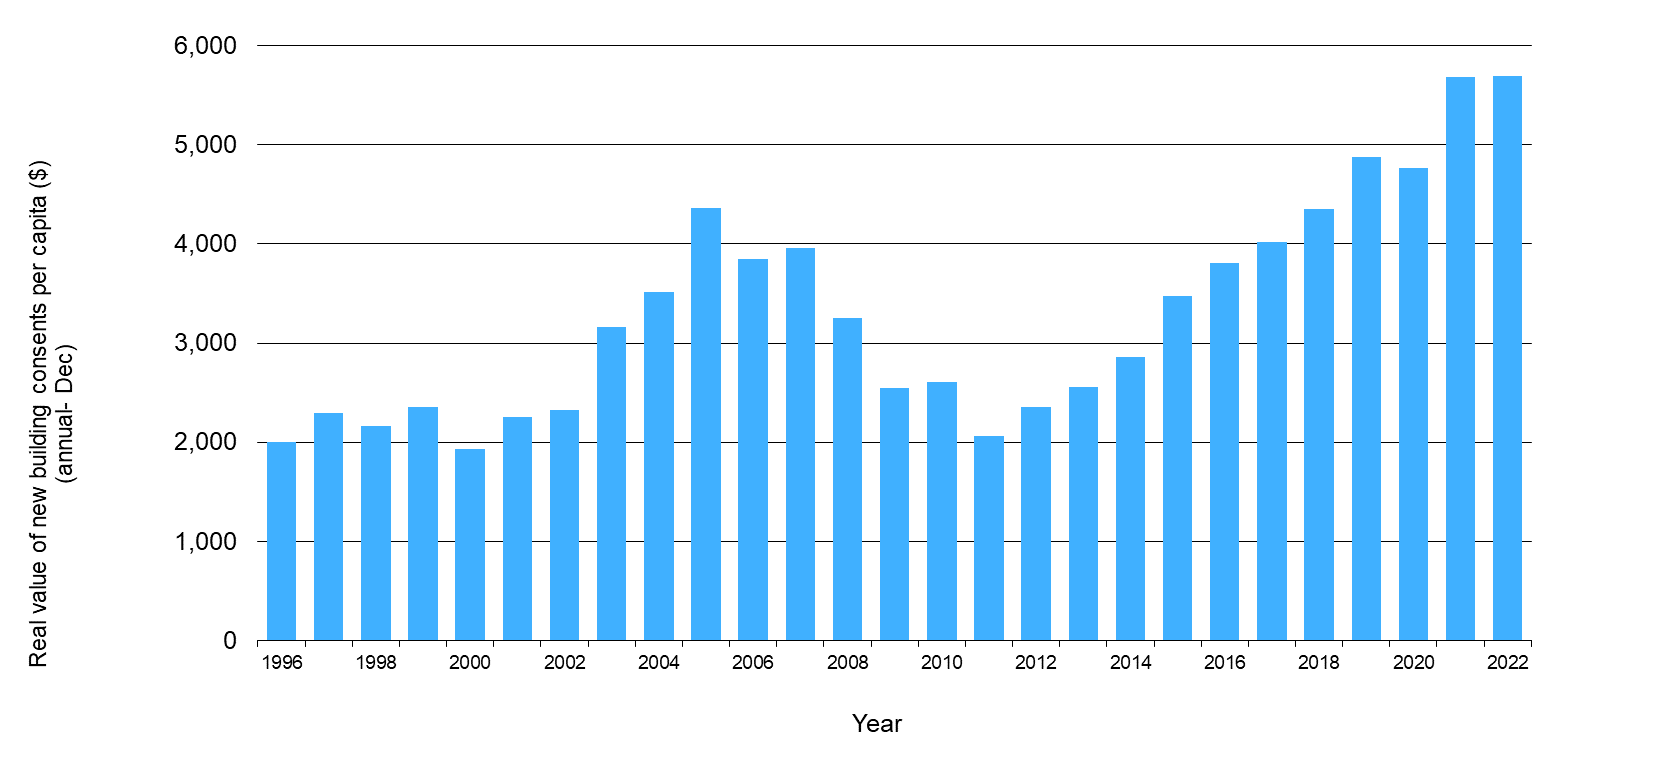
| Year | Real value of building consents authorised per capita ($) (annual - Dec) |
| 1996 | 2,003 |
| 1997 | 2,297 |
| 1998 | 2,167 |
| 1999 | 2,355 |
| 2000 | 1,935 |
| 2001 | 2,251 |
| 2002 | 2,322 |
| 2003 | 3,164 |
| 2004 | 3,516 |
| 2005 | 4,359 |
| 2006 | 3,844 |
| 2007 | 3,963 |
| 2008 | 3,252 |
| 2009 | 2,548 |
| 2010 | 2,606 |
| 2011 | 2,064 |
| 2012 | 2,359 |
| 2013 | 2,558 |
| 2014 | 2,864 |
| 2015 | 3,471 |
| 2016 | 3,809 |
| 2017 | 4,015 |
| 2018 | 4,354 |
| 2019 | 4,872 |
| 2020 | 4,764 |
| 2021 | 5,685 |
| 2022 | 5,695 |
What is this indicator telling us?
- The year to December 2022 showed a record-high value of building activity in the region despite ongoing global impacts and high inflation.
- According to Statistics New Zealand (SNZ) figures, for the Waikato region there was around $2.9 billion of consents issued for all new buildings during the year to December 2022. The annual percent increase in building consent value was 6.3% compared to annual GDP deflator growth of 5.0% and estimated population growth of 1.1%.
- In per capita terms, there was $5,695 of new building consents per person in the Waikato region in 2022, higher than the $5,375 average for New Zealand as a whole.
- Per capita building activity by value within the Waikato region over the past decade has been highest in the Waipā, Waikato and Thames-Coromandel districts and lowest in Rotorua, Waitomo and South Waikato.
DATA SOURCE AND SUPPORTING INFORMATION
Time series results are from the Statistics New Zealand (SNZ) InfoShare database (Number, value and floor area by building type, nature and region (Annual-Mon)). These can be found under Industry Sectors>Building Consents>Building consents by region (Annual-Dec).
These SNZ data have been inflation adjusted to latest year dollars using December quarter year-on-year GDP deflator values compiled by the Reserve Bank of New Zealand (RBNZ)
Secondary indicators available from SNZ include the value and number of new dwelling units and new non-residential buildings authorised.
Update details: Monthly series available online in aggregated year-to-date format. Latest results are published online by SNZ within approximately one month of collection.
Customised data request requirements: Nil
DATA AVAILABILITY – OTHER THAN WAIKATO REGION:
Territorial Authority (TA) disaggregation: Yes.
Other regions: Yes
New Zealand: Yes
Other countries/ Organisation for Economic Co-operation and Development (OECD): No

To ask for help or report a problem, contact us
Tell us how we can improve the information on this page. (optional)