

Housing affordability

 HOUSING AFFORDABILITY
| |
NO SIGNIFICANT CHANGE |
Housing costs as a percentage of household disposable income in the Waikato region are comparable with 2007 baseline levels. There is a high level of annual variability in this measure.
This indicator is the ratio of the Waikato region’s housing costs to household income, from the New Zealand Household Economic Survey (HES).
Why is this indicator important?
Housing affordability relates to three aspects - the ability of people to rent or purchase housing in a locality of their choice at a reasonable price; their capacity to meet ongoing housing costs; and the extent to which their discretionary income is available to achieve an acceptable standard of living. Access to affordable housing is essential if people are to have enough residual income to cover other basic living costs while also saving for irregular or unexpected unavoidable costs. Housing costs take up a large share of the household budget and represent the largest single expenditure for many individuals and families.
Housing affordability
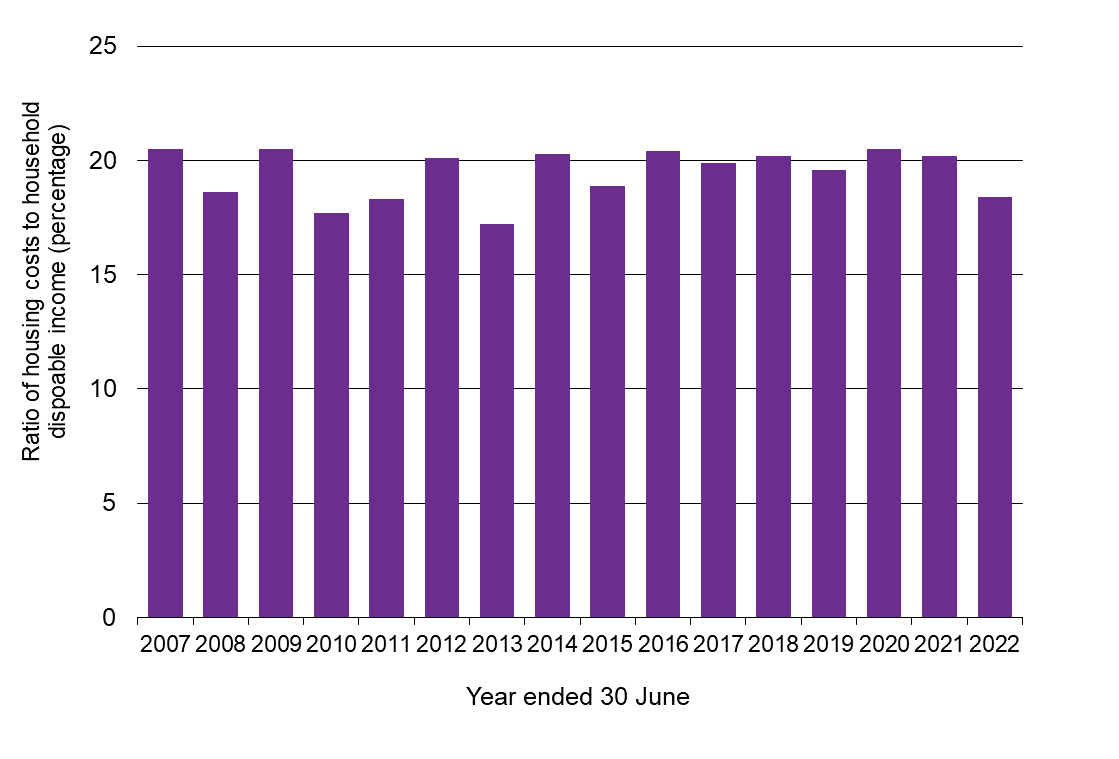
| Year ended 30 June | Ratio of housing costs to total household disposable income (%) |
| 2007 | 20.5 |
| 2008 | 18.6 |
| 2009 | 20.5 |
| 2010 | 17.7 |
| 2011 | 18.3 |
| 2012 | 20.1 |
| 2013 | 17.2 |
| 2014 | 20.3 |
| 2015 | 18.9 |
| 2016 | 20.4 |
| 2017 | 19.9 |
| 2018 | 20.2 |
| 2019 | 19.6 |
| 2020 | 20.5 |
| 2021 | 20.2 |
| 2022 | 18.4 |
What is this indicator telling us?
- On average, households spent about one-fifth of their disposable income on housing costs. The ratio of housing costs to household disposable income at the regional level can vary substantially from year to year.
- The Waikato region tends to have relatively more affordable housing than the national average, due to higher housing costs in Auckland where housing costs equate to around one-quarter of household income.
- The ratio of housing costs to household income in New Zealand is currently the second highest in the OECD. New Zealand is 40th out of 41 (mostly developed) countries in terms of housing affordability.
DATA SOURCE AND SUPPORTING INFORMATION
New Zealand Household Economic Survey (HES) data can be found via Statistics New Zealand (SNZ) website. Data are in the table titled: Housing costs to household disposable income ratios, over all households, by region.
Update details: Annual data to year ended June 2022, with 2023 results expected February or March 2024.
Customised data request requirements: Nil
DATA AVAILABILITY – OTHER THAN WAIKATO REGION:
Territorial Authority (TA) disaggregation: No
Other regions: Yes
New Zealand: Yes
Other countries/ Organisation for Economic Co-operation and Development (OECD): Secondary statistics from the OECD Wellbeing Report: Housing – Key findings.

To ask for help or report a problem, contact us
Tell us how we can improve the information on this page. (optional)