

Public transport

 PUBLIC TRANSPORT
| WORSENING TREND |
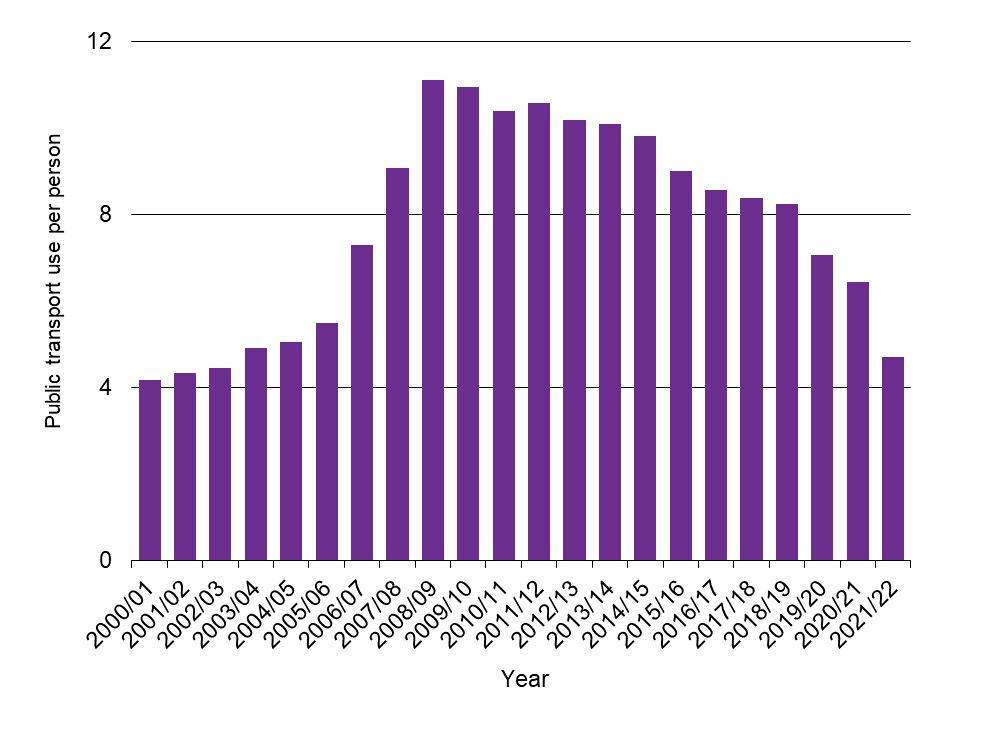
Public transport use per person in the Waikato region peaked in the late 2000s and has subsequently fallen.
This indicator is the average number of passenger transport boardings in the Waikato region per resident per year.
Why is this indicator important?
Public transport is defined as any shared transport service available for use by the general public, such as buses, trains and ferries. Although there is continuing debate as to the true efficiency of different modes of transportation, public transport is generally regarded as significantly more energy efficient than other forms of travel, particularly in metropolitan areas.
Any increase in the number of people using public transport instead of their own vehicle also reduces the numbers of cars on our roads. This improves road safety and journey times for all road users (including public transport vehicles). Improved journey times are not only welcomed by individual travellers; they can assist with improved efficiencies in moving freight within and outside our region. This in turn can contribute to a better regional and national economy. Less use of private vehicles also improves the environment (and people’s health) by reducing air pollution and the emission of greenhouse gases.
Public transport
| Year | Public transport use per person |
| 2000/01 | 4.2 |
| 2001/02 | 4.3 |
| 2002/03 | 4.5 |
| 2003/04 | 4.9 |
| 2004/05 | 5.1 |
| 2005/06 | 5.5 |
| 2006/07 | 7.3 |
| 2007/08 | 9.1 |
| 2008/09 | 11.1 |
| 2009/10 | 11.0 |
| 2010/11 | 10.4 |
| 2011/12 | 10.6 |
| 2012/13 | 10.2 |
| 2013/14 | 10.1 |
| 2014/15 | 9.8 |
| 2015/16 | 9.0 |
| 2016/17 | 8.6 |
| 2017/18 | 8.5 |
| 2018/19 | 8.3 |
| 2019/20 | 7.1 |
| 2020/21 | 6.4 |
| 2021/22 | 4.7 |
What is this indicator telling us?
- The predominant form of public transport in the Waikato region is buses. Over the period 2000/01 to the late 2000s, estimated average use (volumes) of public transport per person per year in the Waikato region almost tripled from 4 to 11 boardings per person. However, in more recent years there has been an ongoing slump in Waikato public transport use, accelerated most recently as a result of Covid-19 and associated commuting changes.
- Public transport use per person in the Waikato region remains well below the national average of 17 boardings per annum. Passenger transport volumes per person are markedly higher in the more metropolitan regions of Auckland and Wellington, although these regions have also seen a substantial decline in boarding numbers in recent years.
DATA SOURCE AND SUPPORTING INFORMATION
Boardings data are available from the NZ Transport Agency (NZTA) online. From the open data webpage, download the file labelled ‘Performance of public transport services’, go to the ‘PT – All Modes’ tab and filter on ‘boardings’.
For this WPI indicator, the boardings data were divided by regional population estimates from Statistics New Zealand (SNZ) NZ.Stat tables, selecting subnational population estimates (RC), to arrive at average public transport passenger boardings per resident per annum.
Update details: Annual data are usually published by NZTA in September each year.
Customised data request requirements: Nil.
DATA AVAILABILITY – OTHER THAN WAIKATO REGION:
Territorial Authority (TA) disaggregation: No
Other regions: Yes, but not a meaningful comparison due to differing geographical and other characteristics.
New Zealand: Yes, but not a meaningful comparison due to differing geographical and other characteristics.
Other countries/ Organisation for Economic Co-operation and Development (OECD): No

To ask for help or report a problem, contact us
Tell us how we can improve the information on this page. (optional)