

Regional GDP

 REGIONAL GDP
| IMPROVING TREND |
There has been growth in real Gross Domestic Product (GDP) per person between 2007 and the year ended March 2022 despite events affecting the economy such as the global financial crisis and COVID-19 pandemic.
This indicator is real (inflation adjusted) regional GDP per person, using Statistics New Zealand’s estimates to the year ended March.
Why is this indicator important?
Gross Domestic Product (GDP) is an internationally accepted measure of economic activity. By using this measure to monitor our region’s economic growth, we can make sound economic decisions which will benefit those living in the Waikato region. Our decisions can also take account of how these benefits can link with other regional, national and global economies.
Real GDP per person
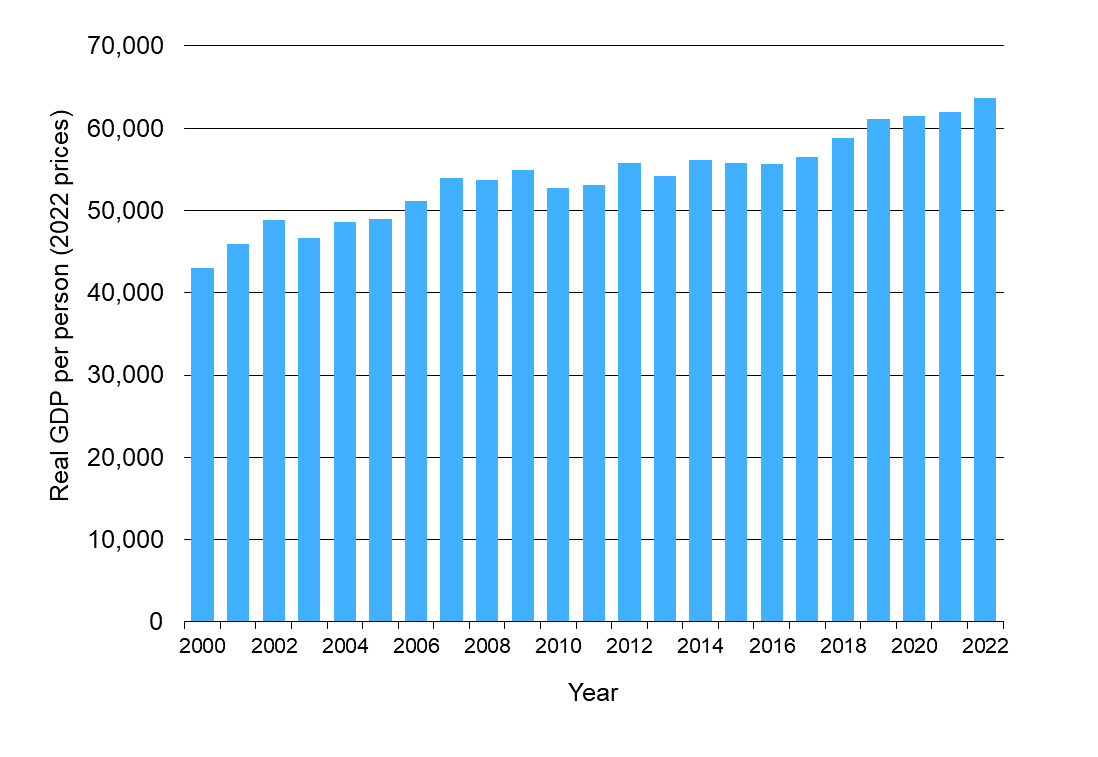
| Year | Real GDP per person (2022 prices) |
| 2000 | $43,018 |
| 2001 | $45,979 |
| 2002 | $48,821 |
| 2003 | $46,712 |
| 2004 | $48,551 |
| 2005 | $49,025 |
| 2006 | $51,168 |
| 2007 | $53,898 |
| 2008 | $53,691 |
| 2009 | $54,868 |
| 2010 | $52,705 |
| 2011 | $53,084 |
| 2012 | $55,761 |
| 2013 | $54,195 |
| 2014 | $56,190 |
| 2015 | $55,729 |
| 2016 | $55,629 |
| 2017 | $56,456 |
| 2018 | $58,850 |
| 2019 | $61,060 |
| 2020 | $61,498 |
| 2021 | $61,968 |
| 2022 | $63,713 |
What is this indicator telling us?
- Waikato is New Zealand’s fourth-largest region economically, making up approximately 9 percent of New Zealand’s GDP in 2022.
- Waikato GDP per person is typically around 10-15 per cent lower than the national average in any given year, largely due to the influence of higher average GDP per person in Auckland and Wellington.
- Waikato real GDP per person remained at around the same level from 2007 to 2016 and has subsequently trended upward.
- Between 2021 and 2022, the Waikato region’s real GDP per person increased by 2.8 per cent compared to an overall national increase of 3.5 per cent.
- According to Ministry of Business, Innovation and Employment (MBIE) modelling of territorial authority GDP, the strongest growth in per capita nominal GDP in the Waikato region over the most recently available full-year period 2018-19 was in Hamilton City (7.6 percent) followed by Matamata-Piako (6.0 percent) and Hauraki District (5.6 percent).
DATA SOURCE AND SUPPORTING INFORMATION
Statistics New Zealand’s annual regional Gross Domestic Product (GDP) estimates are published in current (nominal) prices. These SNZ data have been inflation adjusted to 2022 dollars using March quarter year-on-year GDP deflator values compiled by the Reserve Bank of New Zealand (RBNZ).
Territorial authority level data are from the Ministry of Business, Innovation and Employment (MBIE) - Modelled Territorial Authority GDP.
Update details: SNZ GDP per capita estimates are released in March each year and freely available online.
DATA AVAILABILITY – OTHER THAN WAIKATO REGION:
Territorial Authority (TA) disaggregation: Yes
Other regions: Yes
New Zealand: Yes
Other countries/ Organisation for Economic Co-operation and Development (OECD): Comparative data between New Zealand and other countries/OECD are available for GDP per head in US$ current prices. These values have been converted to a common currency by way of current international prices (i.e. Purchasing Power Parity or PPP). The data shows that New Zealand’s real per capita level of GDP was around $740 below the OECD average in 2020.

To ask for help or report a problem, contact us
Tell us how we can improve the information on this page. (optional)