

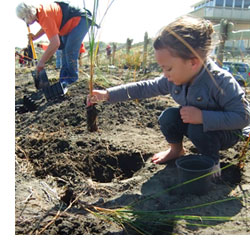
Environmental attitudes

 ENVIRONMENTAL ATTITUDES
| NO SIGNIFICANT CHANGE |
Levels of positive or moderate environmental attitudes from people surveyed in the Waikato region were similar between the 2008 and 2022 surveys.
This indicator is the level of positive or moderate environmental attitudes expressed by people in the Waikato region. It is measured using the NEP (New Ecological Paradigm) Scale score as the percentage of people who scored in the pro- or mid-ecological range.
Why is this indicator important?
Understanding people’s positive or negative attitudes towards protecting the Waikato region’s environment helps councils to focus their activities aimed at achieving this. Monitoring people’s environmental attitudes means we can also find out how much support there is for our proposed actions, policies and rules related to protecting the environment. People’s comments may also reveal which areas in our region are experiencing the most pressures.
This helps us to set goals and target our planning, to ensure we give people the information they need. We also factor their attitudes into the design of our environmental education programmes. Creating a shared understanding of how people’s actions and decisions impact on our region’s environment can encourage people to have a positive attitude towards protecting it. They may become more likely to consider the impact of their own actions and may also become motivated to work together with councils and other people in their community to keep the Waikato region’s environment protected now and in the future.
Environmental attitudes

| Year | New Ecological Paradigm - percentage pro- or mid-ecological |
| 2000 | 90 |
| 2004 | 77 |
| 2008 | 86 |
| 2013 | 89 |
| 2016 | 88 |
| 2019 | 87 |
| 2022 | 83 |
What is this indicator telling us?
- In 2022, 27 per cent of residents had pro-ecological attitudes, 56 per cent had mid-ecological attitudes and 18 per cent had anti-ecological attitudes.
- Since the 2008 WPI baseline year, the proportion of residents defined as pro-ecological has increased by 11 percentage points, while those defined as mid-ecological has decreased 14 percentage points. The net effect is only a small change in the percentage of people with pro- or mid-ecological attitudes over the period 2008 to 2022.
DATA SOURCE AND SUPPORTING INFORMATION
In 2000, 2004, 2008, 2013, 2016, 2019 and 2022, the Waikato Regional Council surveyed adults living in the Waikato region to find out about their attitudes toward the environment using an adapted version of the New Ecological Paradigm (NEP) scale (ranging from pro-ecological to anti-ecological).
The regional result for six survey statements is compiled as the percentage of respondents based on a 6-30 scale: Anti ecological 6-18; Mid ecological 19-24; Pro ecological 25-30.
Data are available online following each survey via Waikato Regional Council’s Environmental Indicators.
Update details: Survey undertaken every three to six years.
Customised data request requirements: Nil
DATA AVAILABILITY – OTHER THAN WAIKATO REGION:
Territorial Authority (TA) disaggregation: Yes
Other regions: No
New Zealand: No
Other countries/ Organisation for Economic Co-operation and Development (OECD): No

To ask for help or report a problem, contact us
Tell us how we can improve the information on this page. (optional)