

Downstream changes to water quality - Waikato and Waipā rivers
Ever wondered how water quality changes down the length of the Waikato and Waipā rivers?
Click on a tile image, above to see a full size pictograph showing the changes in chemistry along the rivers.
These pictographs are derived from data collected over the 2017-2021 period (median values).
What do these changes mean?
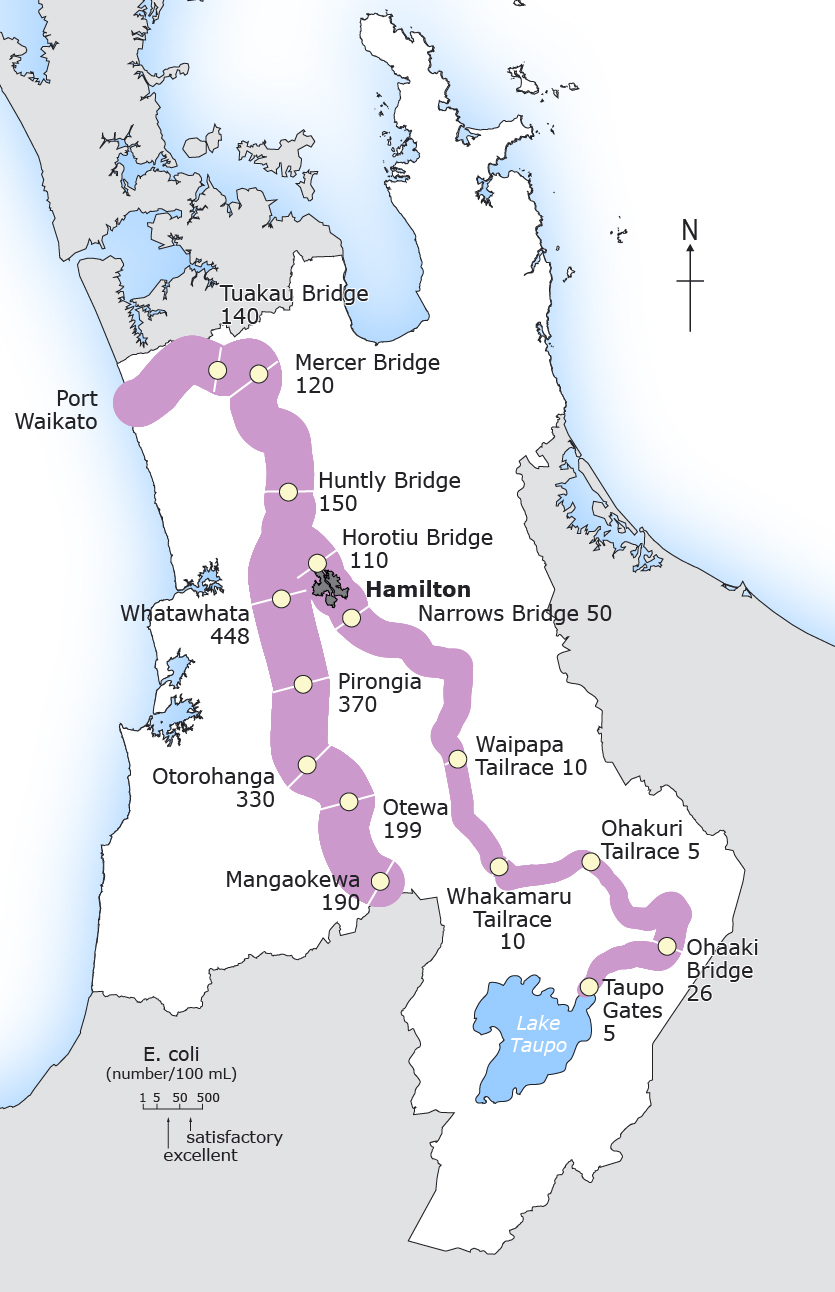
Bacteria levels
Escherichia coli (E. coli) bacteria indicates human health risk from harmful micro-organisms in water that can cause minor illnesses such as ear infections or diarrhoea. The median number of E. coli bacteria in water used for recreation should be below 126 per 100ml.
The purple band shows the E. coli levels along the Waikato and Waipā rivers. The wider the band, the poorer the water quality for contact recreation such as swimming, boating or fishing.
E. coli comes from the dung of farm animals and animals living in the bush, such as pigs and goats and from birds such as ducks and swans. Human sources from sewage are a minor proportion of the total impact on the rivers. In the Waipā River the influence of farm animals is the likely dominant source.
E. coli levels are very low in the upper Waikato because bacteria die off in the hydro lakes. Downstream of Karāpiro, and once the undammed Waipā River joins the Waikato, the levels in the river rise.
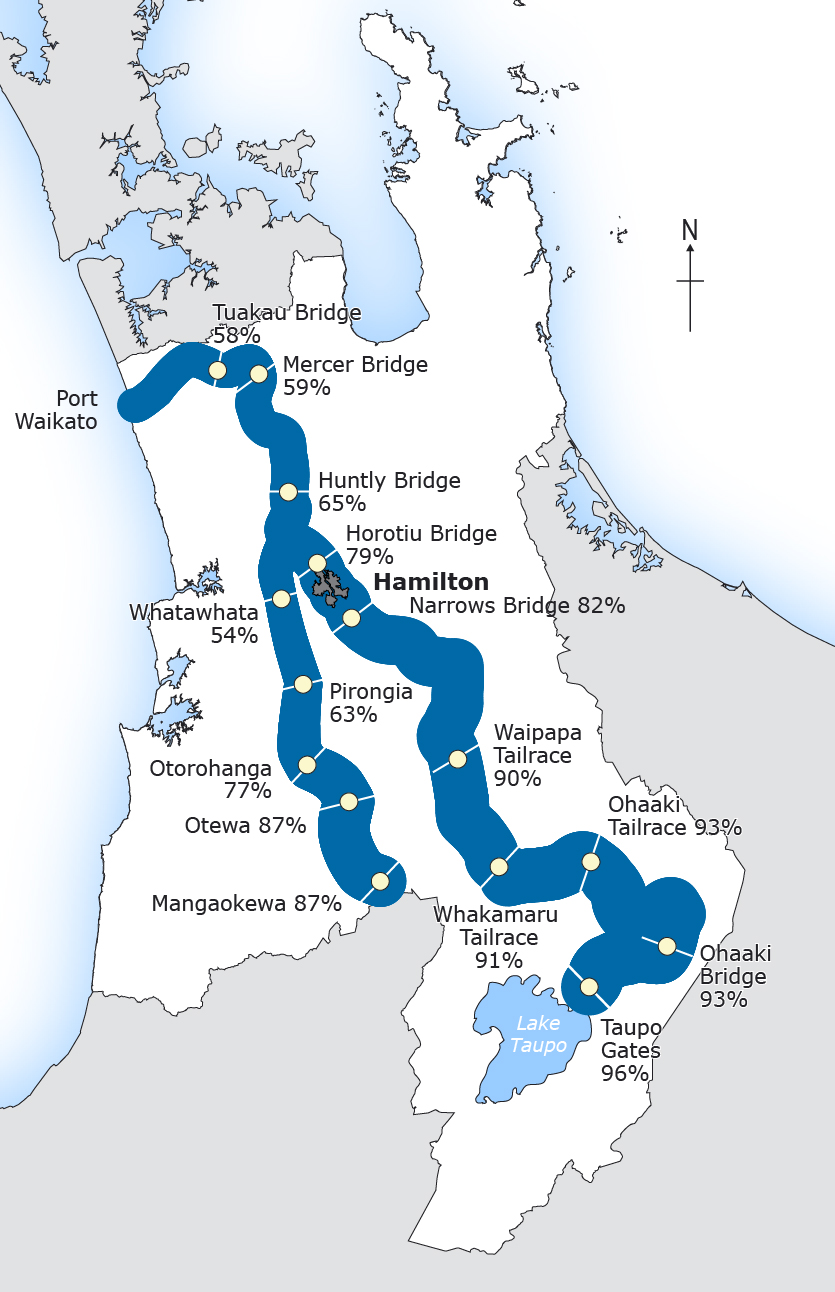
Ecological health
The ecological health measure indicates water’s suitability to support aquatic life such as plants and fish. It includes seven key water quality variables such as dissolved oxygen, temperature and turbidity. It doesn’t indicate the habitat needs of fish and other animals or how many fish are present.
The blue band shows how often water quality is at least satisfactory for supporting aquatic life. The wider the band, the better the water quality for supporting aquatic life.
Water quality for ecological health is:
- better in the upper reaches of the Waikato and Waipā rivers
- poorer in areas where land use is more intensive.
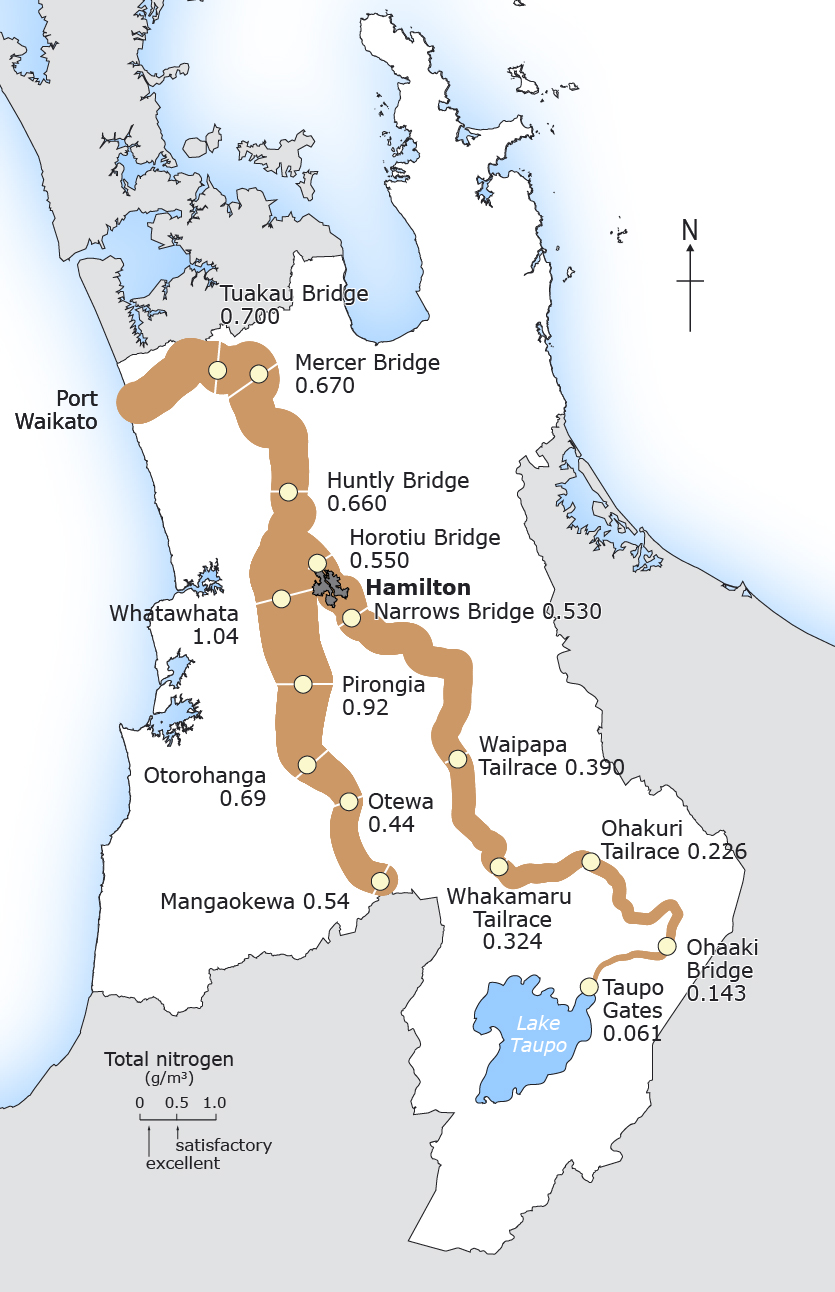
Nitrogen
The brown band shows the increase in total nitrogen down the lengths of the Waikato and Waipā rivers, and the numbers indicate grams per cubic metre of total nitrogen at monitoring sites along the rivers.
Water bodies have a natural background level of nitrogen, which acts as a plant nutrient. This ranges from:
- below 0.1 to 0.3 grams per cubic metre in the Waikato River
- about 0.2 to 0.3 grams per cubic metre in the Waipā River.
Additional nitrogen caused by land use can encourage growth of aquatic weeds and algae.
To prevent excessive growth of nuisance plants, Waikato Regional Council considers total nitrogen levels in water should be less than 0.5 grams per cubic metre. On the pictograph above, 80 per cent of sites on the Waipā and 30 per cent of sites on the Waikato exceed this level.
Much of the overall nitrogen load in the rivers comes from farmland, particularly from urine excreted onto paddocks. Nitrogen leaches through the soil and into groundwater.
Nitrogen levels immediately downstream of Taupō are especially low, as the lake acts as a settling pond, cleaning up water from the upper catchment before it enters the Waikato River.
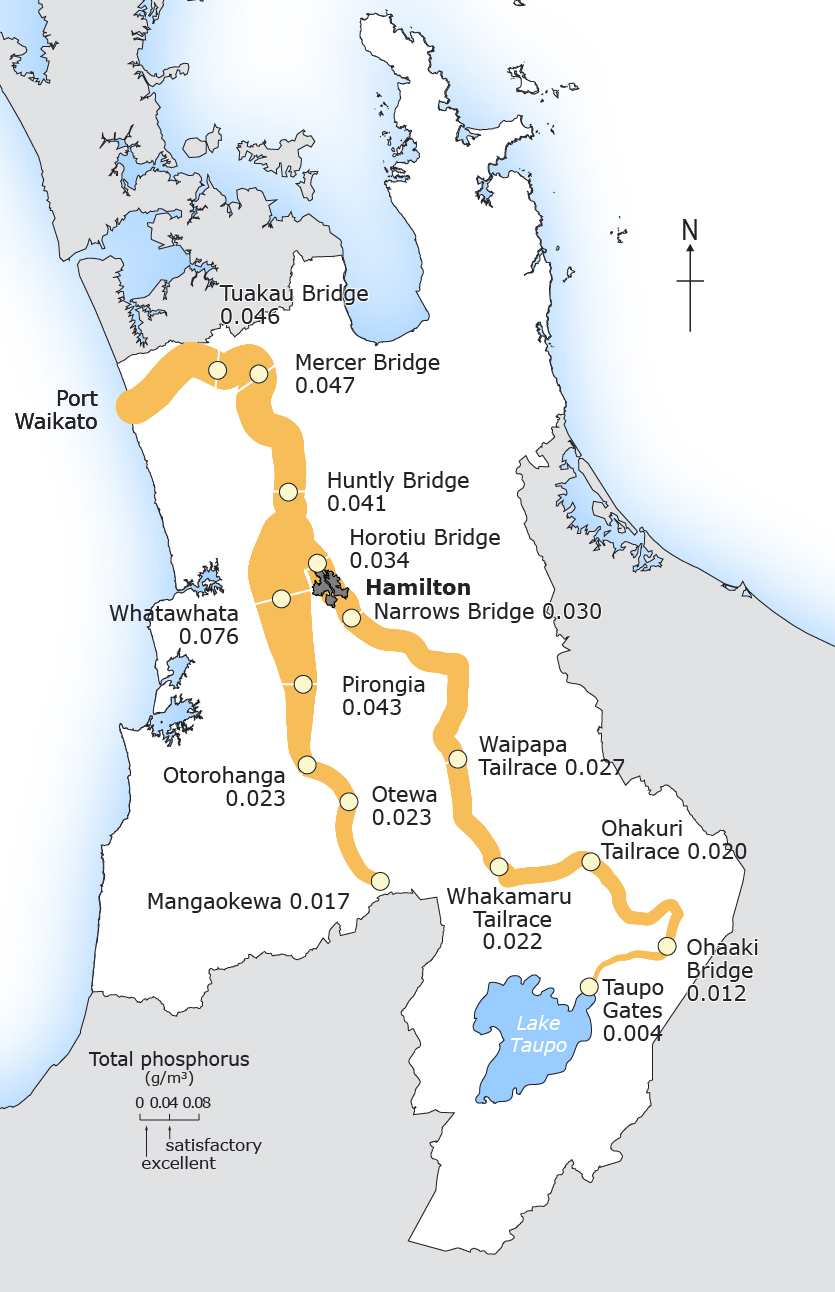
Phosphorus
The orange band shows the increase in total phosphorus down the lengths of the Waikato and Waipā rivers. The numbers indicate grams per cubic metre of total phosphorus at monitoring sites along the rivers.
Water bodies have a natural background level of phosphorus, which acts as a plant nutrient. This ranges from:
- below 0.01 to 0.03 grams per cubic metre in the Waikato River
- about 0.02 to 0.03 grams per cubic metre in the Waipā River.
Additional phosphorus caused by land use can encourage growth of aquatic weeds and algae.
To prevent excessive growth of nuisance plants, Waikato Regional Council considers that total phosphorus levels in water should be less than 0.04 grams per cubic metre. On the pictograph above, 40 per cent of the sites on the Waipā and 50 per cent of the sites on the Waikato exceed this level.
Most phosphorus in the rivers comes from soil washed off farmland.
Phosphorus levels below Taupō are especially low because the lake acts as a settling pond, cleaning up water from the upper catchment before it enters the Waikato River. Phosphorus levels in the Waipā are higher than in the upper Waikato River because of geology and land use.
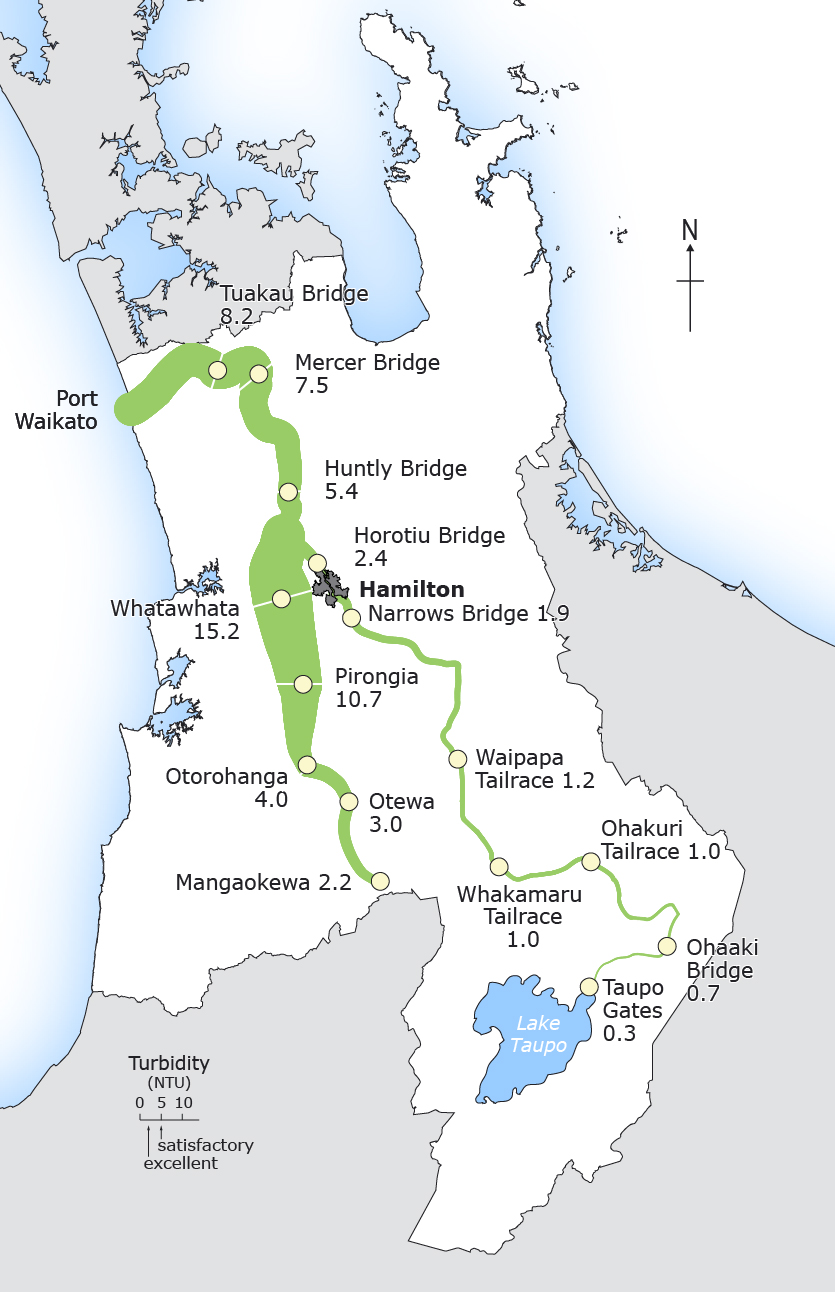
Turbidity
Turbidity is a measure of water’s murkiness, reflecting the amount of suspended sediment in the water. Aquatic plants need light for photosynthesis. To support plant life, turbidity should be less than 5 NTU (turbidity measurement).
The green band shows turbidity levels along the Waikato and Waipā rivers. The wider the band, the poorer the water quality for plant life, fish and other animals. The numbers indicate NTU.
The Waipā’s turbidity is poorer than the Waikato’s, due to the Waipā catchment’s geology and land use. Also, the Waikato’s hydro lakes trap much of the sediment coming off the upper Waikato catchment.
What's going on, where?
You can also click on the map pins below to find out about what may be affecting water quality at various locations along the rivers.
View WRP river changes July 2012 in a larger map

To ask for help or report a problem, contact us
Tell us how we can improve the information on this page. (optional)