

Why we monitor coastal developments at risk
Private properties and dwellings are at risk from coastal erosion and coastal flooding hazards along parts of the Waikato Regions’ coastline. Waikato Regional Council has a responsibility under the Regional Policy Statement (RPS) to gather and communicate information about coastal hazards to territorial authorities. This indicator monitors the extent of coastal development within defined coastal erosion hazard areas and identifies areas of greatest coastal erosion hazard risk and those requiring long-term coastal erosion management strategies. This indicator also allows us to develop and monitor the success of coastal management practices. Successful management practices should result in decreasing levels of coastal development (specifically dwellings) within hazard lines over time.
Available data indicates that very few of our Region’s beaches are currently eroding permanently, but instead undergo cycles of erosion and accretion. However, rising sea levels and increased frequency and intensity of storm events are predicted to occur in the future from projected climate change. These climate change impacts are expected to worsen coastal erosion and flooding hazards and may drive a more widespread trend for long-term erosion. The long-term hazard area identifies the width of coastal margin that might be at risk from coastal erosion associated with predicted sea level rise over the next 100 years and provides some insight into the long-term management implications for coastal settlements. The extent to which sea level rise is expected to exacerbate erosion varies greatly depending on the location and physical characteristics of the shoreline.
Some shorelines such as sandy beaches are constantly changing and the shoreline on a sandy beach will naturally move, depending on whether sand is being deposited or eroding away. In many areas on the Waikato coastline, development has occurred close to the sea, particularly near our beaches and the natural movement of the shoreline may threaten beachfront properties and houses. District plans contain development controls that apply to the current and future coastal erosion hazard areas, which will restrict and place conditions on development within these areas.
To stop erosion and protect beach-front properties residents and landowners may want to build protection works such as seawalls and groynes and these erosion protection works can have serious effects on the beach. For example, when a seawall is placed on an eroding beach the beach in front of the seawall becomes lower and narrower and the beach becomes completely submerged at high water or erodes completely. This loss of beach area affects the beach’s appearance, natural character and beach-goers’ ability to enjoy the beach.
What's happening?
Beaches on the coastline, particularly on the Coromandel Peninsula have been heavily developed over the last 50-60 years, mostly for private residential use. Shorelines undergo natural changes in position, so there is a width of coastal margin that is at risk from natural coastal erosion. Residential properties and dwellings have been developed close to the sea, within this potentially vulnerable zone.
Frontal sand dunes reduce the risk to coastal properties from coastal erosion. However, in many areas in the Region (particularly the Coromandel Peninsula), sand dunes have been removed to improve views and for amenity purposes such as reserves or car parking. This has increased the risk to property from erosion and coastal flooding.
Hazard areas have been estimated and development controls put in place to manage land development adjacent to many coastlines in the Waikato Region. The hazard areas identify areas vulnerable to coastal erosion hazard and define the space should be left between a building, such as a house, and the shoreline. The aim of development controls and setbacks is to reduce risk to property from coastal erosion in the long term. Setbacks have been used on the eastern Coromandel since the early 1980s but were most recently reviewed in 2009 and 2012. Coastal hazard areas have been in place in some areas within the Waitomo District for a number of years and are currently under review in both Waitomo and Waikato Districts.
There are two coastal hazard areas identified here. The current hazard area identifies the area currently at risk from coastal erosion associated with natural shoreline changes and current sea level. These are usually temporary fluctuations in the shoreline position that are driven by natural processes. In the case of a cliff shoreline, this area is the width of coastal margin currently vulnerable to slope instability due to erosion at the base of the cliff. The width of this area varies greatly depending on the location but is typically between 10 and 60 metres from the toe of the dune, bank or cliff, depending on the shoreline. The width of this hazard zone can be much greater near river mouths and estuary entrances.
The second coastal hazard area relates to the longer-term hazard and identifies a further area of coastal land that is likely to be at risk from coastal erosion in response to sea level rise over the next 100 years. This setback is not applied on the western coast of the Coromandel Peninsula, where long term coastal flooding hazard has greater management implications than erosion.
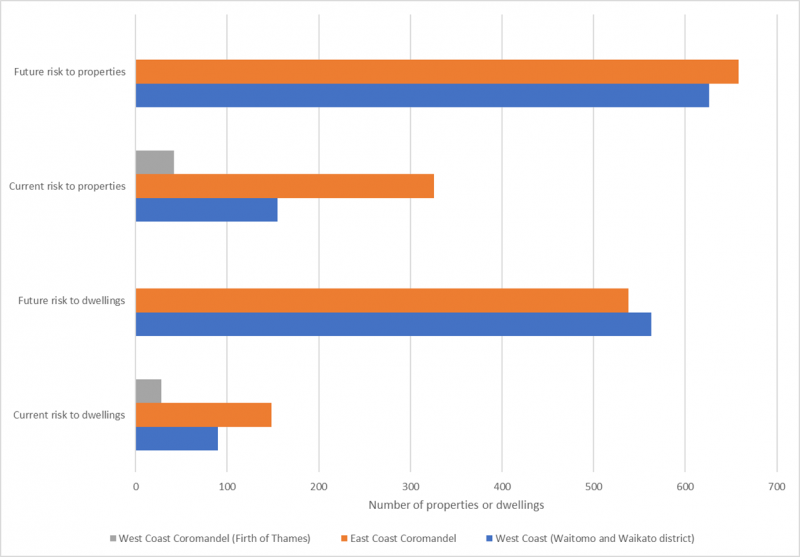
This indicator reports the number of properties and dwellings located in each of the two coastal development setback zones. Results show no clear historical trend but, in the future, we would hope to report a decreasing trend in properties and dwellings at risk. A decreased risk could be due to implementation of development setbacks, so as new houses are constructed, they are moved outside the hazard zone and or due to council controls on subdivision in hazard areas.
In the Waikato and Waitomo Districts, the hazard areas remain in draft form and are subject to change during the notification and hearings process. This is the first time that data has been reported in these Districts, so there is no trend to consider.
Methods - How we monitor
Results - data and trends
Download the data file
This Excel spreadsheet contains the source data to this indicator's graph and any additional data.

When this indicator is updated
This indicator will be updated when new aerial photographs areavailable (generally every 5 years).

To ask for help or report a problem, contact us
Tell us how we can improve the information on this page. (optional)