

Managing farm phosphorus
Where phosphorus comes from
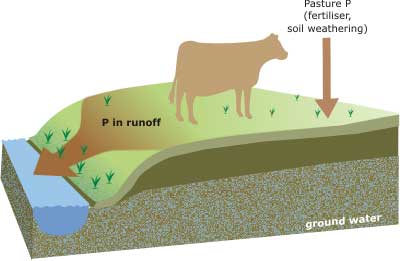
On the farm, phosphorus is supplied to the soil from:
- fertiliser
- animal effluent
- natural ‘weathering’ of rock and soil.
Most of the phosphorus in the environment is stored in sediment and rock. To aid pasture growth phosphorus is usually added to farm soils in fertiliser.
Regular soil testing allows you to check your soil’s Olsen P levels and avoid unnecessary spending on fertiliser if soil phosphorus is already at optimum levels. Monitoring your soil nutrient status can help improve both the economic and environmental performance of your farm business.
The phosphorus cycle
Phosphorus isn’t naturally found in the air. Unlike the nitrogen cycle, there isn’t an atmosphere component to the phosphorus cycle. See the phosphorus cycle below.
The pie charts below give you a rough idea what happens to phosphorus on a typical dairy or drystock farm. The pale green area on each graph is the amount of phosphorus going off the farm as product.
How phosphorus affects waterways
Phosphorus behaves very differently to nitrogen. It binds with soil and only dissolves slowly in water over time. Although it doesn’t readily leach into ground water, phosphorus can still pollute waterways via:
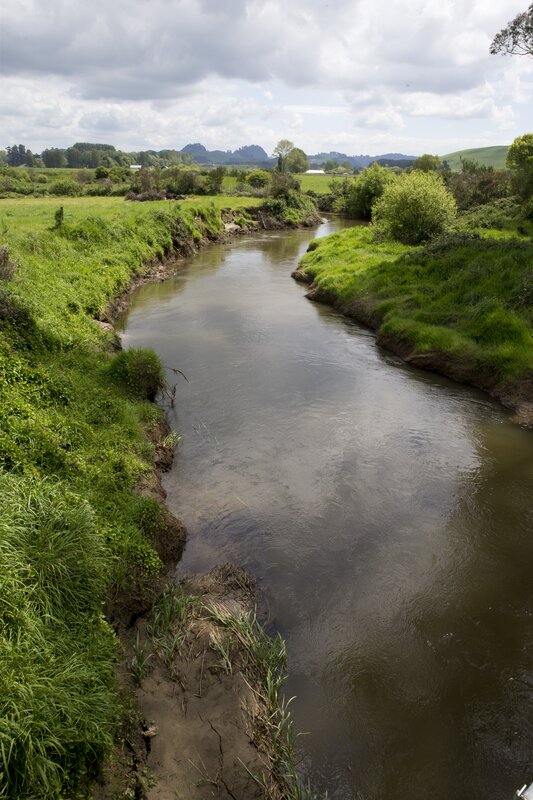
During soil erosion, valuable soil and phosphorus are lost from a farm. They often end up in waterways where they affect water quality.
During wet periods, when you can see dirty runoff going into waterways, it is likely to contain soil particles and phosphorus. Phosphorus is found at very low levels in the natural environment, so small increases in the amount of phosphorus going into waterways can have a big effect.
Phosphorus in waterways encourages nuisance weed and algae growth, which:
- affects stream life – by ‘starving’ the water of oxygen when it dies off
- blocks water intakes
- makes water unpleasant for swimming and drinking.
The table below shows the percentage of phosphorus entering the Waikato, Piako and Waihou rivers from:
- agriculture
- point sources - such as, sewage works and factory discharges
- background levels - such as from undeveloped land.
|
Source |
Waikato River (1990-96 data) |
Piako River (1993-97 data) |
Waihou River (1993-97 data) |
|
Agriculture |
30 to 60% |
25% |
51% |
|
Point sources |
27% |
62% |
31% |
|
Background levels |
10 to 40% |
13% |
18% |
Reducing the effects of phosphorus on waterways
Reduce the amount of phosphorus entering waterways by:
- preventing direct application of fertiliser to waterways – for more information check out the NZ Fertiliser Manufacturer’s Research Association’s Code of Practice for Fertiliser Use
- maintaining your soil Olsen P levels at optimal levels, not above - more is wasteful
- avoiding phosphate fertiliser application if you know heavy rain is coming.
Reduce the amount of runoff and erosion on your farm by:
- fencing off waterways and leaving an ungrazed grass strip to filter sediment and phosphorus from runoff
- avoiding pugging of soils, especially in paddocks close to waterways
- avoiding overgrazing and bare soil, especially in paddocks close to waterways
- controlling runoff from tracks, races and feedpads to prevent it reaching waterways
- applying your farm dairy effluent to land, following good practice guidelines.
Remember that many pasture soils in the Waikato region are over-fertilised.
The phosphorus cycle
Phosphorus isn’t naturally found in the air. Unlike the nitrogen cycle, there isn’t an atmosphere component to the phosphorus cycle. Check out the phosphorus cycle below.
The pie charts below give you a rough idea what happens to phosphorus on a typical dairy or drystock farm. The pale green area on each graph is the amount of phosphorus going off the farm as product.

To ask for help or report a problem, contact us
Tell us how we can improve the information on this page. (optional)