

River water quality for contact recreation
Why we monitor river water quality for contact recreation
Waikato Regional Council routinely monitors a representative cross-section of regional rivers and streams to assess the suitability of water quality for human water recreation activities, such as swimming, kayaking and water-skiing.
Sometimes ‘bad bugs’ from human and animal faeces – micro-organisms such as protozoans, bacteria and viruses – can get into waterways.
These ‘bad bugs’ can cause illness when people are exposed to them. Other contaminants such as fine silts and clays reduce the clarity of the water, making it difficult to see and avoid submerged hazards like snags.
What's happening?
We monitor 10 sites on the Waikato River and 105 sites on other rivers and streams throughout the region.
An average ‘pass rate’ for two water quality measures (faecal bacteria levels and water clarity) is determined for each site.
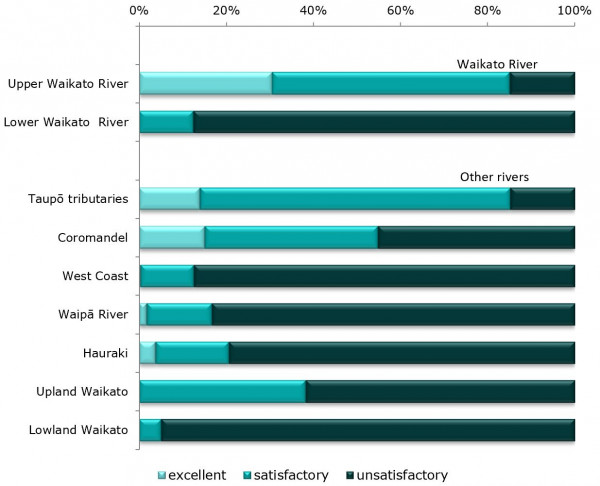
River water quality for contact recreation is good in some parts of the region (for example, the upper Waikato River, tributaries of Lake Taupō, and in the Coromandel). In the lowland areas, river water quality is not so good (for example, Hauraki and the lowland tributaries of the Waikato River).
This largely reflects the greater intensity of land use in the lowland parts of the region, with higher levels of faecal bacteria and fine silts, and highlights the impact of non-point sources of contamination such as runoff from agricultural land and urban areas.
The Waikato Regional Council has begun to assess the relative importance of various point and non-point sources of contamination using this information together with our resource consents database.
Methods - how we monitor
Results - data and trends
The Excel spreadsheet below contains the source data for this indicator's graph and information.
The graph shows the percent of samples from rivers around the region meeting or exceeding our water quality guidelines (excellent, satisfactory or unsatisfactory) for contact recreation.
You can also see the individual monitoring results at each our monitored sites, here.
The data were collected from 2015-2019.
Percentage of samples meeting our guidelines for excellent, satisfactory or unsatisfactory river water quality for contact recreation (2015-2019)

More information
When this indicator is updated
This indicator is updated annually.
Technical reports
Updated October 2021