

Why we monitor land use
The Waikato region contains some of the most productive land in New Zealand and the world. The landscape and soils vary in versatility and productive capacity. Different types of land use affect our soil resources differently.
We monitor land use change to get information on where development pressures are likely to be greatest, and to help us identify policy responses to avoid or remedy damage to our soil and water resources.
What's happening?
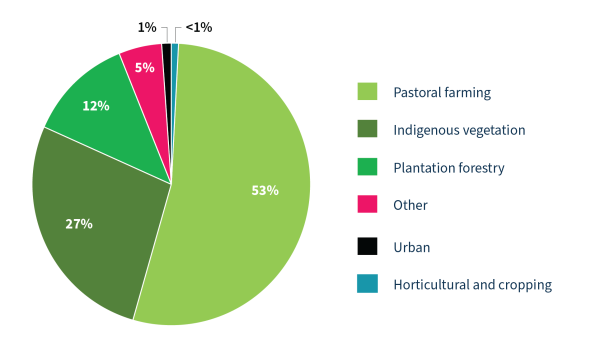
The main land use types in the Waikato region are:
- pastoral farming (53%)
- indigenous vegetation (27%)
- plantation forestry (12%)
- urban areas (1%)
- horticulture and cropping (less than 1%).
How we monitor
Data and trends
View the data file
The link below points to an Excel spreadsheet that contains the source data to this indicator's graph and any additional data

When this indicator is updated
Due to the time scale at which land use changes occur, it is unlikely that changes will be monitored any more frequently than 5-yearly. The updating of this indicator is also dependent on production of an updated LCDB dataset.
Quality control procedures
For information on data quality (lineage, positional accuracy, attribute accuracy, logical consistency and completeness) see the updated metadata for the LCDB available from the dedicated Land Cover Database (metadata).
Footnotes
- The LCDB v5.0 dataset is a “public good” data set created by Landcare Research New Zealand Ltd and available under Creative Commons Attribution V4.0 International Licensing.
- New Zealand Land Cover Database User Guide.

![map [JPG, 732 KB]](/assets/WRC/WRC-2019/webmap_landuse_2018_150dpi.jpg)
To ask for help or report a problem, contact us
Tell us how we can improve the information on this page. (optional)