

Nitrate in groundwater
Why we monitor nitrate in groundwater
In 1988, a national survey of nitrate contamination of groundwater found some of the highest nitrate concentrations in parts of the Waikato region1.
Nitrate moves down into groundwater from land use activities at the surface. Concentrations are generally highest in shallow, vulnerable aquifers and lowest in very deep or iron-rich waters.
Nitrate is the most widespread contaminant in groundwater. Nitrate is an environmental and health indicator of land use affects as excessive nitrate is a concern for both human health and the environment.
Excessive nitrate concentrations are linked to a blood disorder in bottle-fed babies known as ‘blue baby syndrome’ (methaemoglobinaemia). Nitrate seepage from groundwater into streams and lakes can also result in nutrient enrichment of these waterways and coastal waters.
Elevated nitrate concentrations typically indicate pollution from land use activities such as applying farm dairy effluent to land, use of nitrogen fertilisers, waste and domestic sewage disposal.
High nitrate concentrations are also a concern because of potential barriers to market access with trading nations.
This indicator measures nitrate concentrations in the Waikato region’s groundwater supplies. Waikato Regional Council collects groundwater information from two monitoring networks. We use this information to tell us about the quality of the region’s groundwater supplies for human and environmental health.
What's happening?
In our region, higher nitrate concentrations are generally found in areas of market gardening (such as Pukekohe) and intensive dairy farming (such as Hamilton). In the Hauraki Plains there is a general trend of decreasing nitrate concentration northward with progressively low-lying, finer and peaty sediments. This is associated with a change from recharge to discharge flow regimes and reducing groundwater conditions such as lower redox.
We have few records to indicate long-term nitrate trends, but long-term information from some schools supplies (since 1950s) indicates a steady increase in nitrate at these sites. Pressures on groundwater quality are generally increasing as land-use intensifies. The total volume of wastewater consented to discharge to land has increased steadily. In 1997 the total volume was 540,000 m3 d-1.
How we monitor
Data and trends
The link below points to a file that contains the source data to this indicator's graph and any additional data.
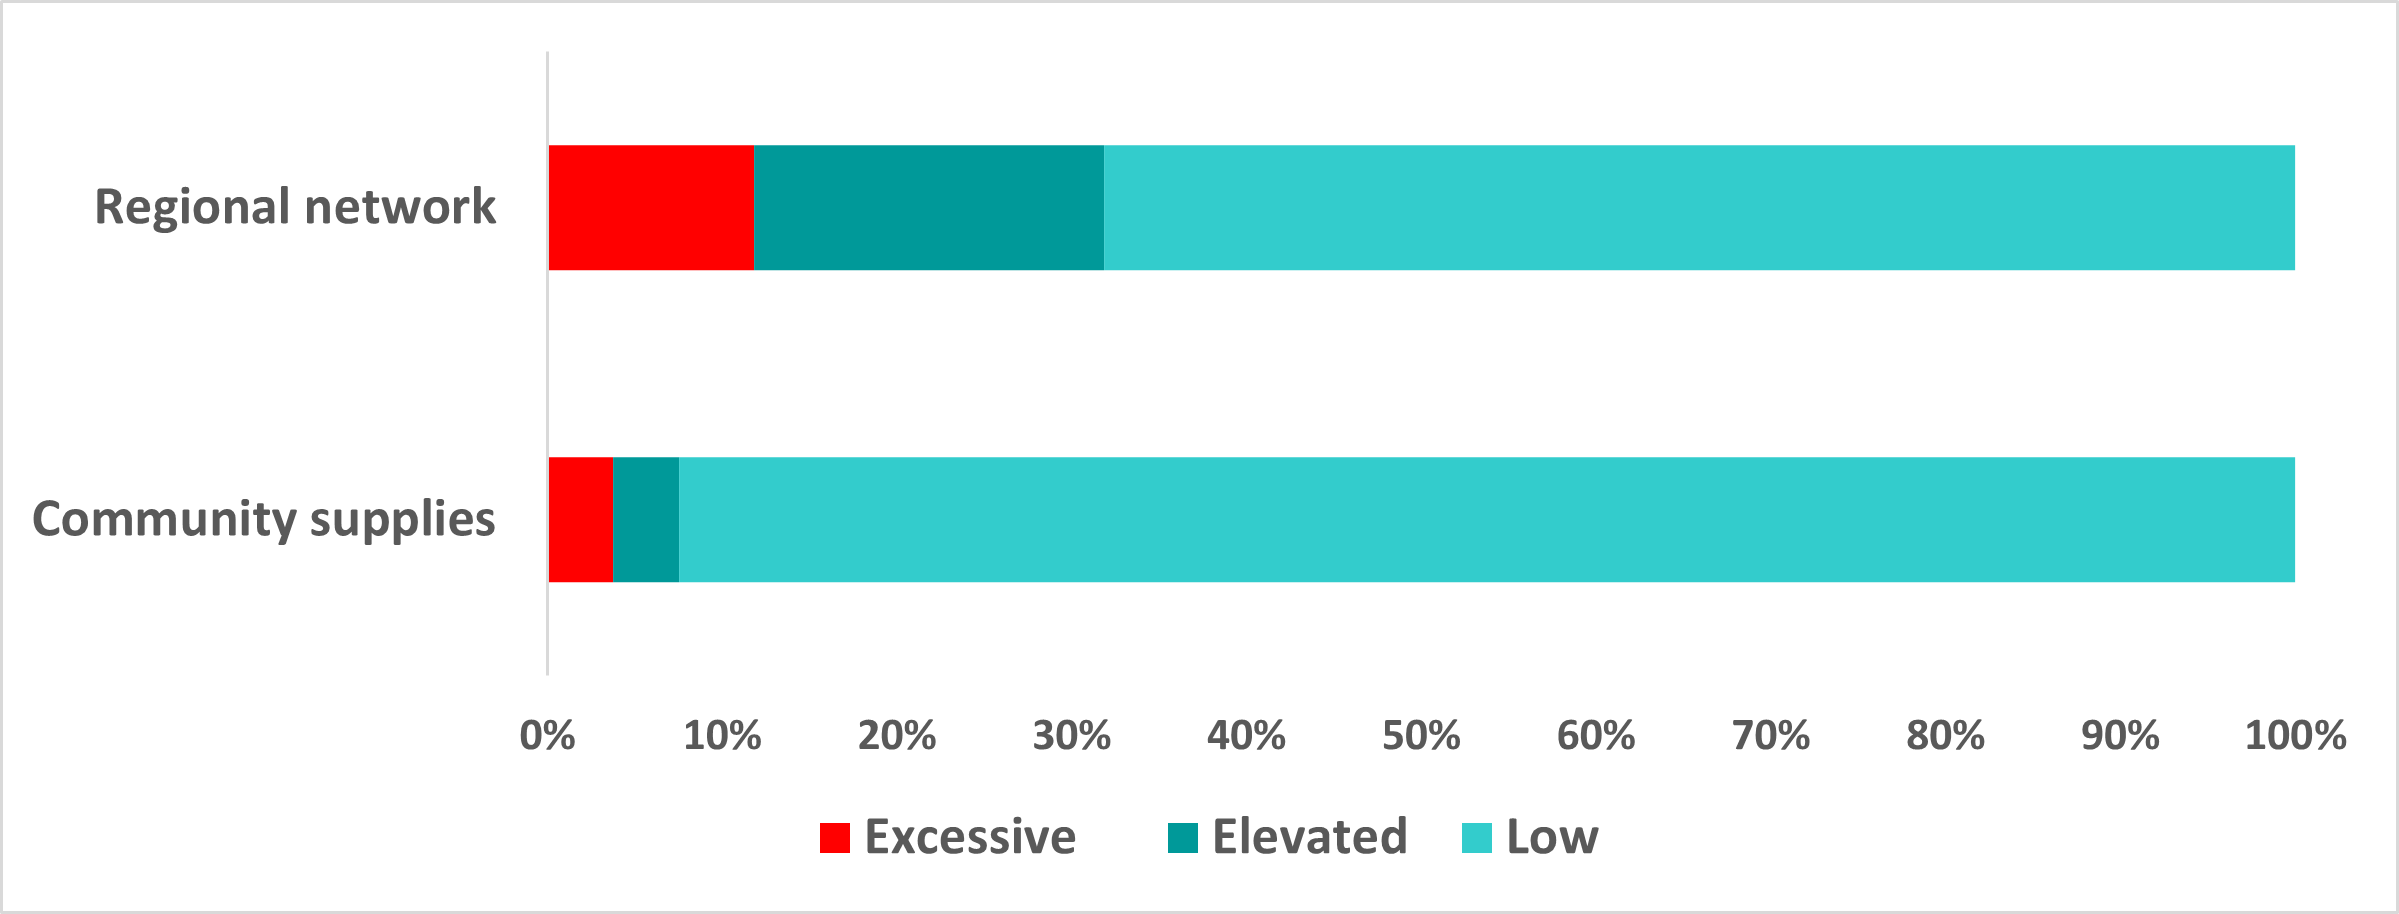
Occurrence of nitrate in Waikato monitoring wells

More information
When this indicator is updated
The nitrate indicator is updated every two years. It will next be updated in 2022.
Updated July 2021.
Footnotes
- Lincoln Environmental, 1998: A Survey of Nitrate Contamination of New Zealand Aquifers. A report for the Ministry of Agriculture and Forestry. Lincoln.
- Groundwater nitrate can be expressed as either nitrate (NO3) or nitrogen in nitrate (NO3 - N) so the national drinking water guideline of 50 g/m3 NO3 is equal to 11.3 g/m3 NO3 - N.
Quality control procedures
Rosen, M. R., S. G. Cameron, C. B. Taylor and R. R. Reeves. 1999: New Zealand Guidelines for the Collection of Ground Water Samples for Chemical and Isotopic Analyses. The Institute of Geological and Nuclear Sciences. Lower Hutt. 1999/9.

To ask for help or report a problem, contact us
Tell us how we can improve the information on this page. (optional)