

Soil stability
Why we monitor soil stability
The Waikato Regional Council monitors soil stability to get a measure of the quantity of soil in place (stable) and how much has been subjected to erosion and has the potential to generate sediment. It provides information about how particular land use disturbances and natural erosion is affecting the soil resource across the region. Accelerated erosion can lead to the loss of the soil's productive capability, damages to fences, tracks, roads and houses, damage to native habitats or animal habitats, adverse effects on the aesthetic and cultural values associated with land and sediment being generated that could enter waterways.
Measuring the stability of the soil gives us an understanding of its natural stability – how it has been affected by natural erosion processes and an understanding of how land management practices have affected its stability and accelerated erosion. The soil resource is important for farming, forestry, conservation and residential/commercial use so it is important to understand how well the soil resource is remaining in place and what are the factors influencing erosion.
What's happening?
Soil stability is a measure of how well the region’s soil is being kept in place as a resource for farming, forestry, and conservation. In 2017, 49 per cent of the observed sample points contained surfaces that were stable. These surfaces showed no signs of past natural erosion and are completely vegetated (unless the topsoil is disturbed by land use activities such as cultivation and tracking).
Approximately 26 per cent of the observed sample points contained surfaces that were unstable and erosion prone (these included surfaces which showed signs of past erosion but were not currently eroding). About 17 per cent of the sample contained land that had been recently eroded or was eroding at the time of the aerial survey. These areas require careful management and have a limited range of productive land uses.
Extensively disturbed surfaces included areas of land where soil had been removed in whole or in part, re-contoured, or covered by buildings pavements or water. In 2017, 8 per cent of the observed sample points contained surfaces that were extensively disturbed.
The changes in soil stability between 2007 and 2017 are shown in Figure 1. There has been a statistically significant increase in the percentage of sample points within the unstable surfaces (erosion prone) category from 24 per cent in 2007 to 26 per cent in 2017. This increase appears to have been at the expense of stable surfaces which decreased significantly from 52 per cent in 2007 to 49 per cent in 2017. Over the last five years, there has been a significant decrease in unstable eroded and eroding surfaces from 19 per cent in 2012 to 17 per cent in 2017. The percentage of sample points within the extensively disturbed category has not changed significantly over the preceding 5 or 10 years.
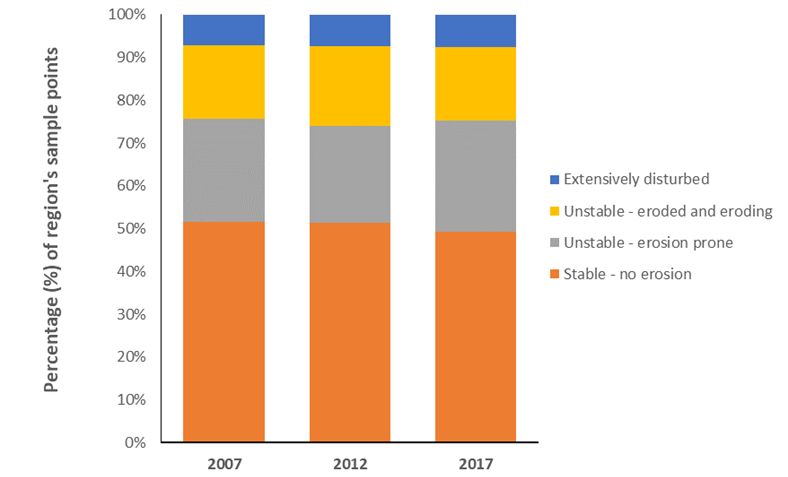
Figure 1. Percentage of sample points that contained stable, unstable and extensively disturbed land surfaces across the Waikato region, 2007 – 2017.
How we monitor
Data and trends
Download the data file
The link below points to an Excel spreadsheet that contains the source data to this indicator's graphs and any additional data.

When this indicator is updated
The indicator is updated as aerial photography for the region becomes available generally every five years.

To ask for help or report a problem, contact us
Tell us how we can improve the information on this page. (optional)