

Why we monitor fertiliser use on farms
Waikato Regional Council monitors changes in pasture fertility and nutrient losses to get information on the trends and risk nutrient losses are likely to have for water quality. Monitoring also helps us identify policy responses to avoid or remedy damage to our soil and water resources.
It is important to know whether the region's soils are being mined of nutrient reserves or if excess fertiliser is being applied and risking water quality. Monitoring nitrogen and phosphorus inputs and changes in soil phosphorus levels provides information about the balance of these nutrients in pastoral soils.
We regularly monitor nitrogen and phosphorus concentrations in surface and groundwater throughout the region. Our monitoring information, together with predictive modelling based on stock density and terrain, can be used to help explain any observed increases or decreases in nutrients.
Nutrient levels in water are linked to algal growth. Increasing trends in nutrient levels can be used to predict and manage 'hotspots' where nitrate concentrations in water are approaching or exceed critical limits.
This indicator estimates the average amounts of :
- nitrogen (N) fertiliser added to pastoral soils
- nitrogen fertiliser leached from pastoral soils
- phosphorus (Olsen P) levels in dairy farm soil
- phosphorus lost through runoff.
Losses of these nutrients affect water and air quality.
Total nutrient inputs should be close to total nutrient losses. If the inputs are greater than outputs, the soil nutrient levels will increase and higher losses to water bodies are more likely. Alternatively, soil nutrient levels will decrease if the inputs are less than the losses. This is not desirable because over time the soils will become 'exhausted' and unproductive.
What's happening?
The Waikato region contains some of the most productive land in New Zealand and the world.
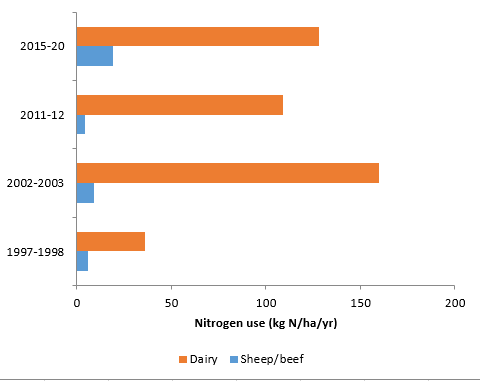
In 2019-20, average dairy farm nitrogen fertiliser use was 128 kg N/ha/yr. Previously, dairy farm nitrogen fertiliser use had varied from 36 kg N/ha/yr in 1997-98, 160 kg N/ha/yr in 2002-03 and 109 kg N/ha/yr in 2011-12. Yearly nitrogen fertiliser use on sheep/beef farms was 6 kg N/ha/yr in 1997-98, 9 kg N/ha/yr in 2002-03, 4 kg N/ha/yr in 2011-2012 and 19 kg N/ha/yr in 2015-2016.
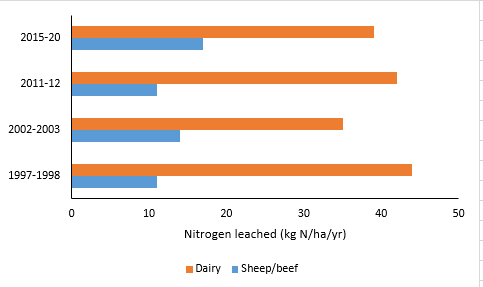
Nitrogen leaching results have been consistently about 40 kg N/ha/yr. In 19-20, nitrogen leaching for dairy was 39 kg N/ha/yr. Previously, dairy farm nitrogen leaching was 44 kg N/ha/yr in 1997-98, 35 kg N/ha/yr in 2002-03 and 42 kg N/ha/yr in 2011-12. Nitrogen leaching for sheep, beef and deer farms has also been stable, between 11 to 17 kg N/ha/yr.
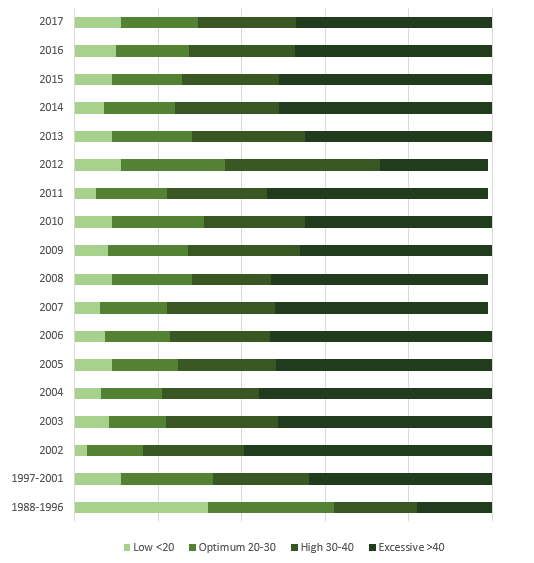
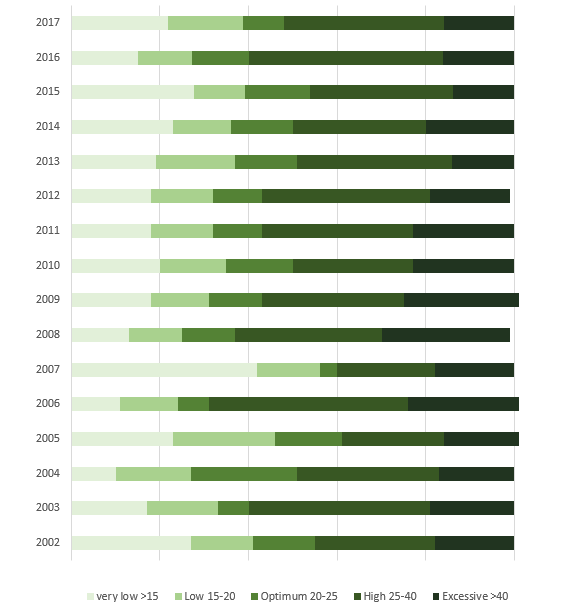
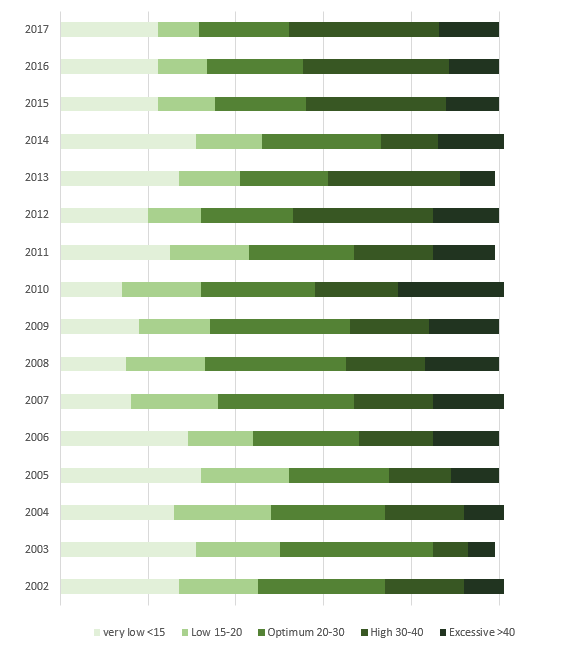
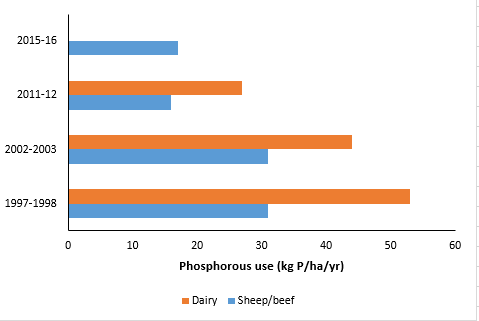
On average, phosphorus fertility on dairy farms is near the maximum for a high producing farm. Since 1997, about half of the soil samples from volcanic and sedimentary soils have shown excessive phosphorus fertility, compared to about one-fifth in 1988-1996.
The results for farms on volcanic soils have remined constant but the results for dairy farms on sedimentary soils have improved after being considerably worse compared to those on volcanic soils. Between 2002 and 2011 about two-thirds of the soil samples from these farms had excessive Olsen P (phosphorous) compared to about half in 2012-2013.
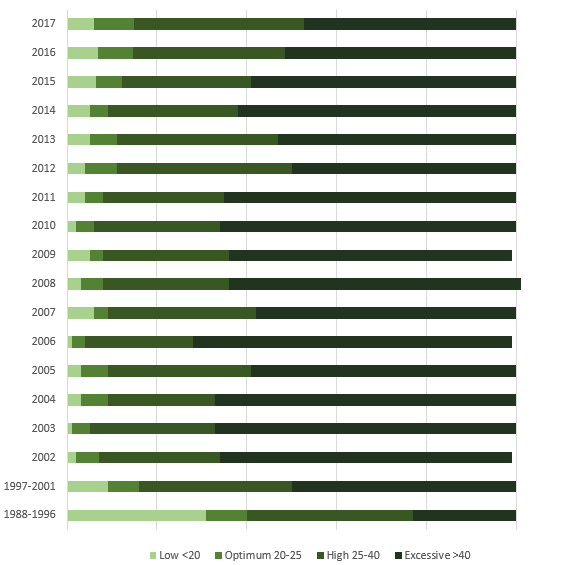
Sheep and beef farms with excessive Olsen P levels have fluctuated between 6-26% on sheep and beef farms. About 8-14 percent of soil samples had excess phosphorus fertility in 2013, compared to 15-25 percent in 2010. Olsen P data in 2013 was similar to the data from 2002 (about 9-18 percent). In 2017, 14-16 percent of sheep and beef farms had excessive Olsen P.
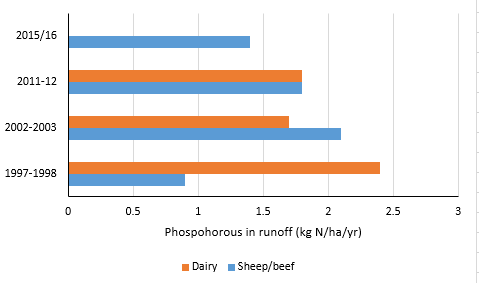
Yearly phosphorus run-off is similar for dairy and sheep and beef farms, fluctuating between 0.9 and 2.4 kilograms of phosphorus per hectare. The value for sheep and beef reflects the hilly nature of these farms; the steeper the slope, the more phosphorous is likely to run off. In comparison, dairy farms have higher Olsen P levels than sheep and beef farms. More P in the soil means more P in the runoff.
How we monitor
Data and trends
Download the data file
The Excel spreadsheet below contains the source data for this indicator's graph and information.

When this indicator is updated
This indicator is updated every three years.

To ask for help or report a problem, contact us
Tell us how we can improve the information on this page. (optional)