

Nitrogen dioxide levels in air
Why we monitor nitrogen dioxide levels in air
Nitrogen dioxide (NO2) is a gas that affects lung function. NO2 emissions can occur directly from combustion processes and as a result of the conversion of nitric oxide gas (also produced from combustion processes) reacting in the atmosphere in the presence of ozone.
The main sources of NO2 are the burning of fossil fuels (for example, coal, gas and oil) and motor vehicle emissions. In urban areas the main source of NO2 is motor vehicle emissions. NO2 is therefore a useful indicator for the impact of vehicle emissions on air quality and is used as a general proxy for air pollution from motor vehicles. The recent Health and Air Pollution in New Zealand study (HAPINZ 3.0) found that NO2 from motor vehicles accounts for over half the health and social costs associated with air pollution.
NO2 affects people’s lungs by aggravating asthma and by decreasing their ability to fight infection - for example, bacterial lung infections. People most sensitive to nitrogen dioxide include young children, children and adults with asthma and adults with respiratory problems.
Results - data and trends
Highest concentrations of nitrogen dioxide (NO2) are likely to occur within close proximity to busy intersections and road corridors in or near urban areas.
In 2005 the Government set national environmental standards for air quality (NESAQ), including a standard for NO2 of 200 mg/m3 as a one-hour average. It allows nine hours per year when concentrations can be greater than 200 µg/m3.
The Waikato Regional Plan also sets guideline concentrations for NO2 at 200 mg/m3 as a one-hour average and 100 mg/m3 as a 24-hour average.
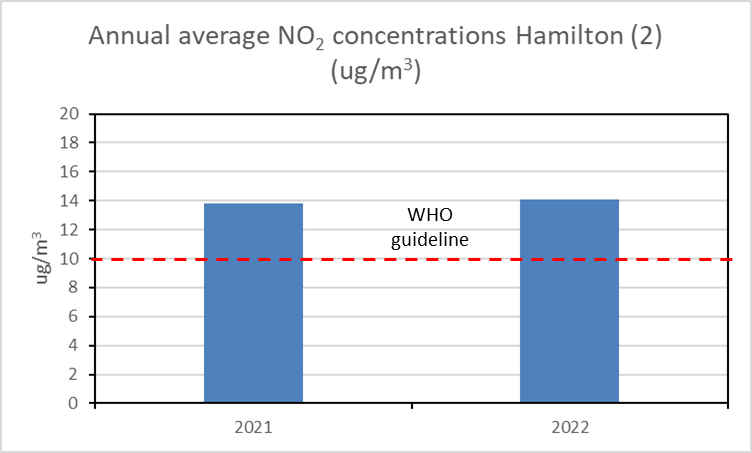
In 2021, the World Health Organization (WHO) released the following updated guidelines for NO2:
- Annual average guideline of 10 ug/m3
- 24-hour average guideline of 25 ug/m3 (3-4 allowable exceedances per year)
- One-hour average guideline of 200 ug/m3
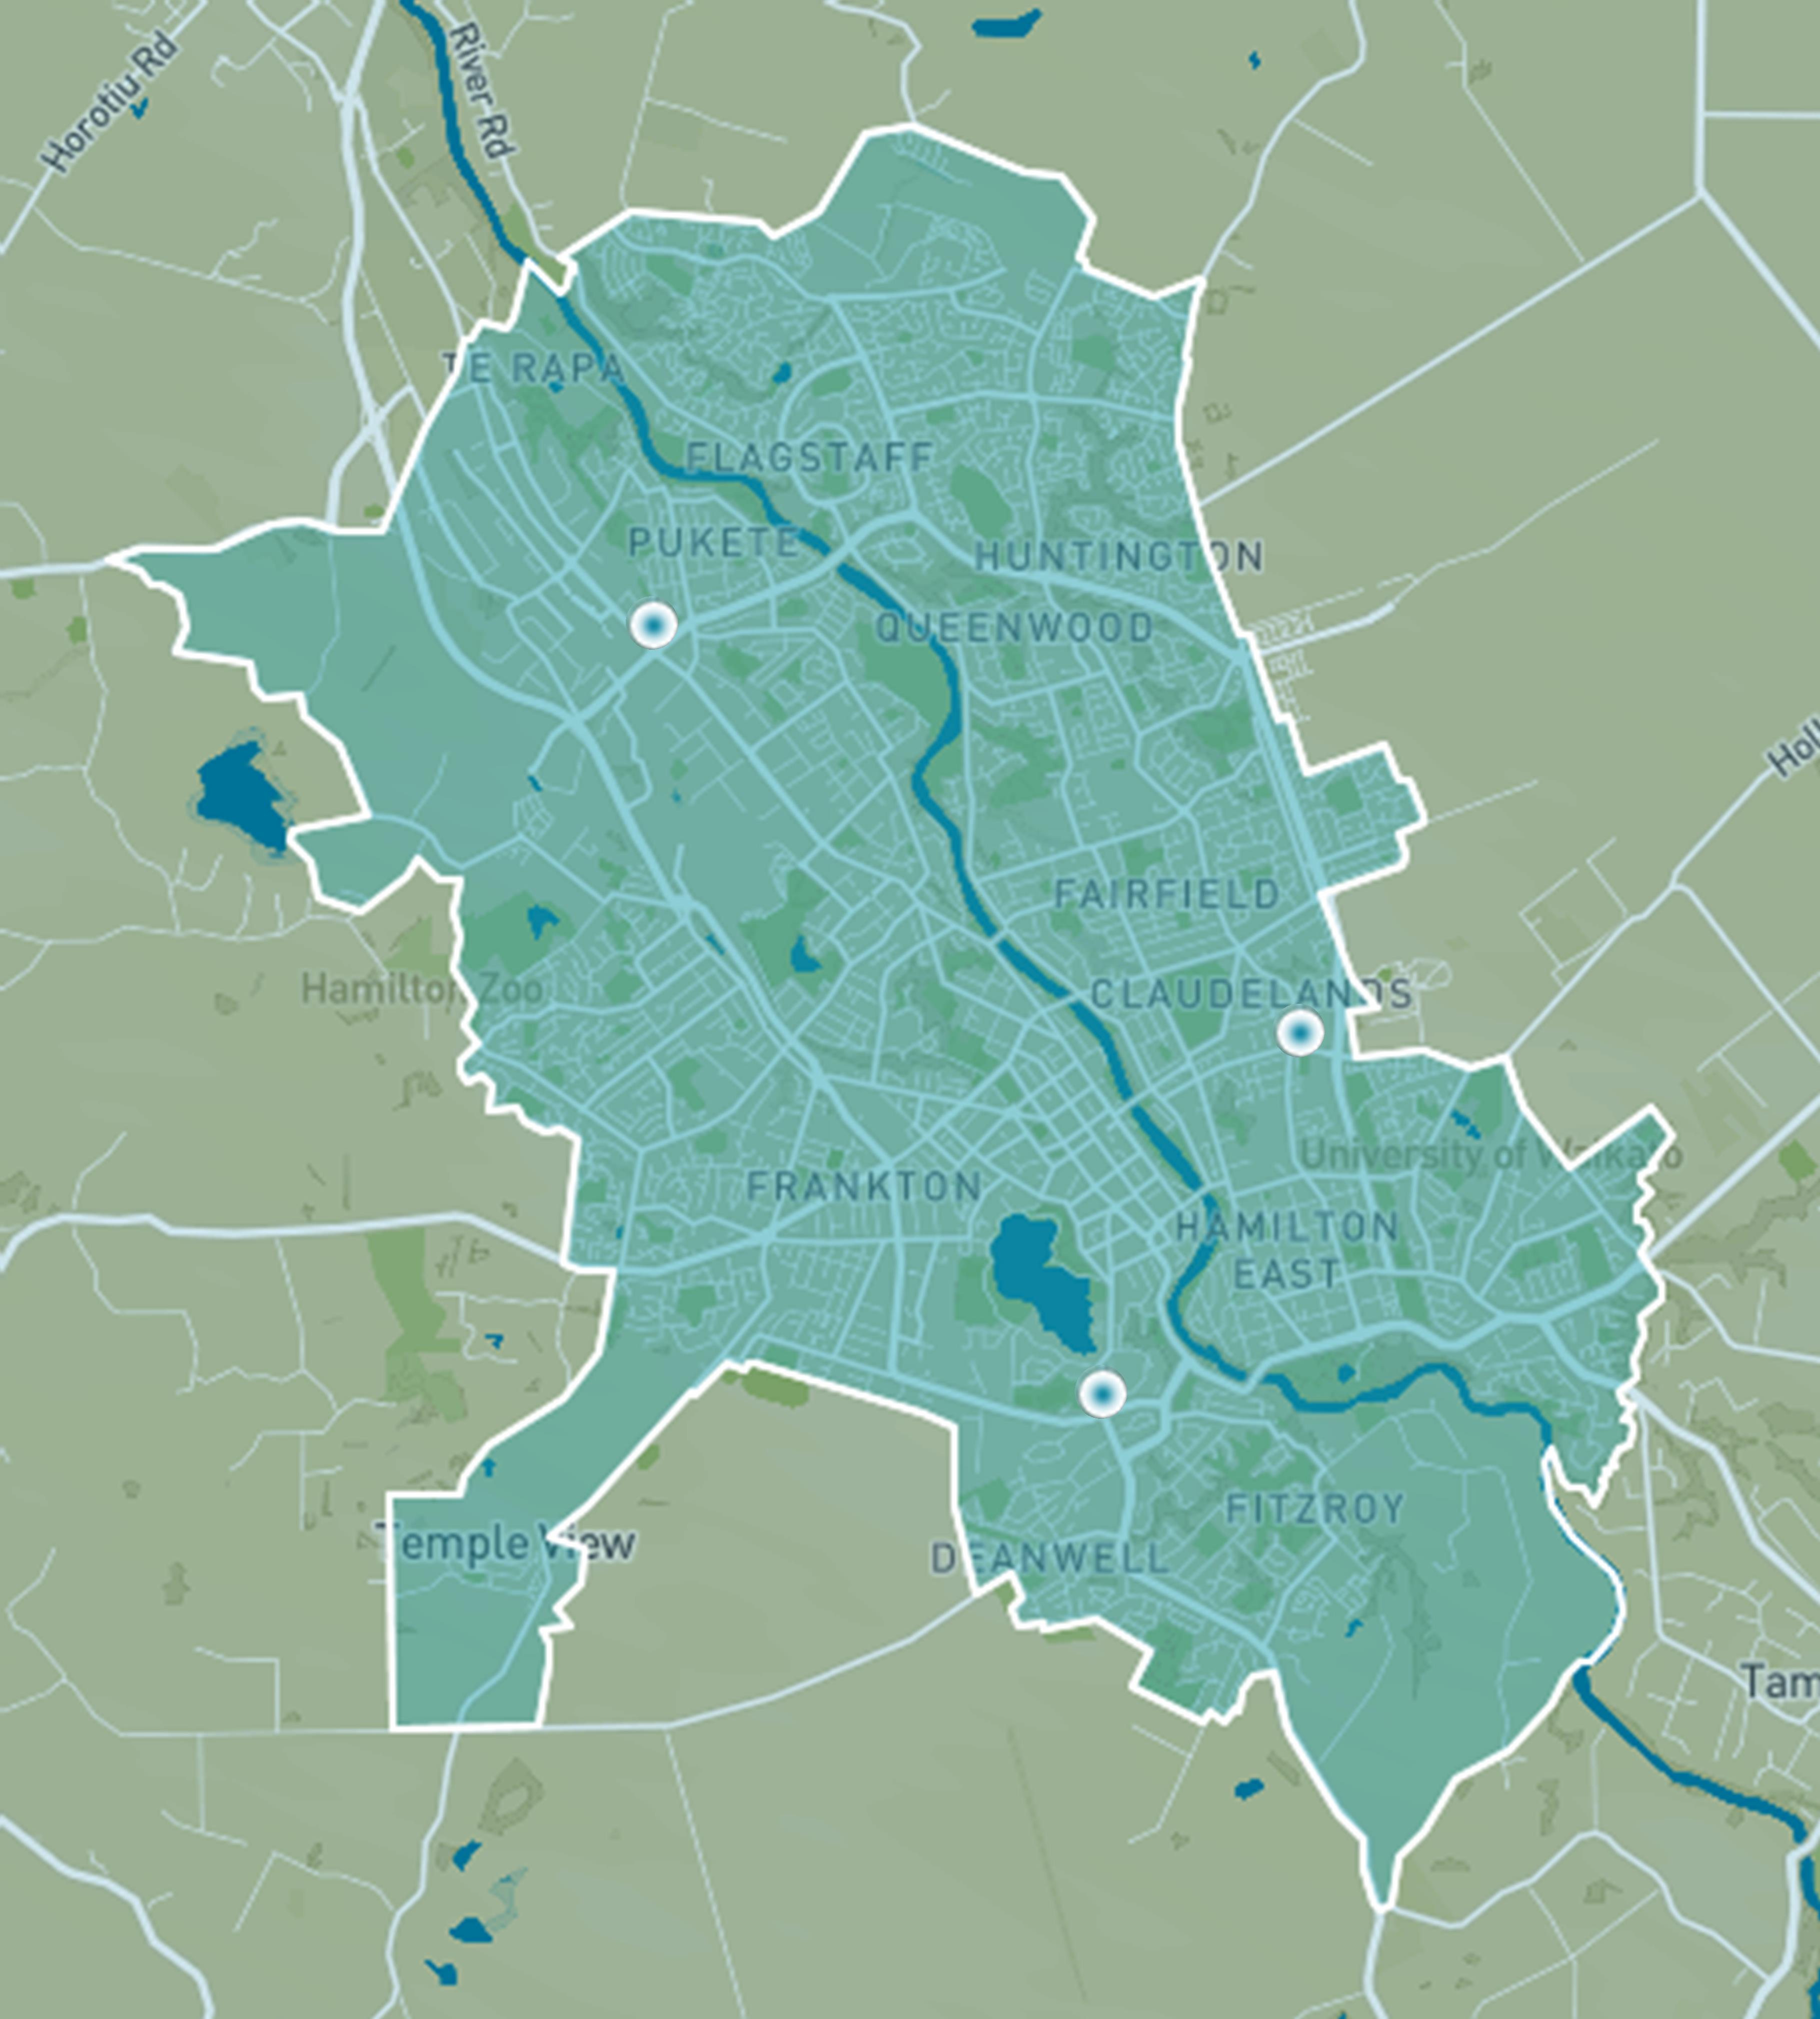
Monitoring of NO2 in Hamilton, compliant with the demands of the air quality standard, has been conducted by Waikato Regional Council over limited periods on Peachgrove Road, Te Rapa Road and Ohaupo Road using an instrument capable of monitoring on a continuous basis within an air conditioned station enclosure. Since June 2020, monitoring of NO2 using this methodology has become permanent at the Ohaupo Road station. No valid breaches of the NES one-hour standard for NO2 have been identified at the Peachgrove Road or Ohaupo Road sites but a number of exceedances of this standard were identified in 2012 at the Te Rapa site which were caused by a large number of truck movements through the intersection during the construction of the Te Rapa Bypass. Subsequent monitoring did not identify further breaches.
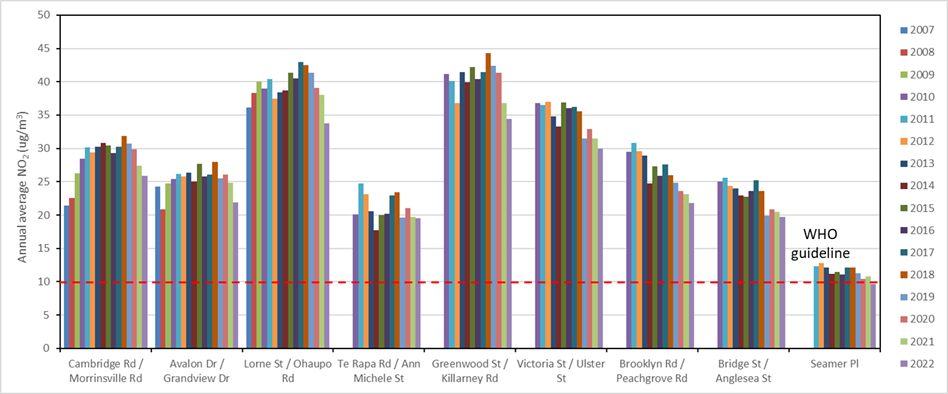
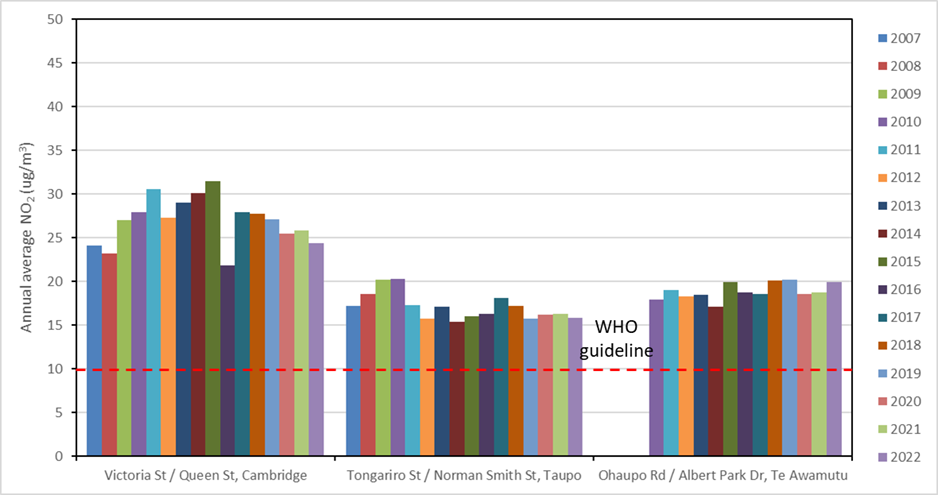
The NZ Transport Agency (NZTA) undertakes passive NO2 monitoring in Hamilton, Te Awamutu, Taupō and Cambridge with contributory funding from Waikato Regional Council on an annual basis. Passive monitoring typically involves the use of small sampling tubes containing a reactive chemical that reacts with air borne contaminants, can be easily installed on a power pole for example close to a busy roadway, and exposed for a month before being taken to a laboratory for analysis. While this method does not permit direct assessment of NO2 levels against the NESAQ one-hour average standard, it does allow an approximate comparison with the World Health Organisation (WHO) annual exposure guideline of 10 μg/m3 that was introduced in 2021 as a significant update to the previous annual average guideline of 40 μg/m3.
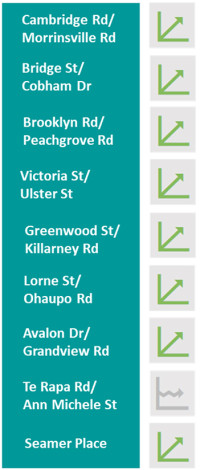
NZTA’s monitoring has identified that all sites within the Waikato region exceed the 2021 WHO annual guideline of 10 μg/m3.
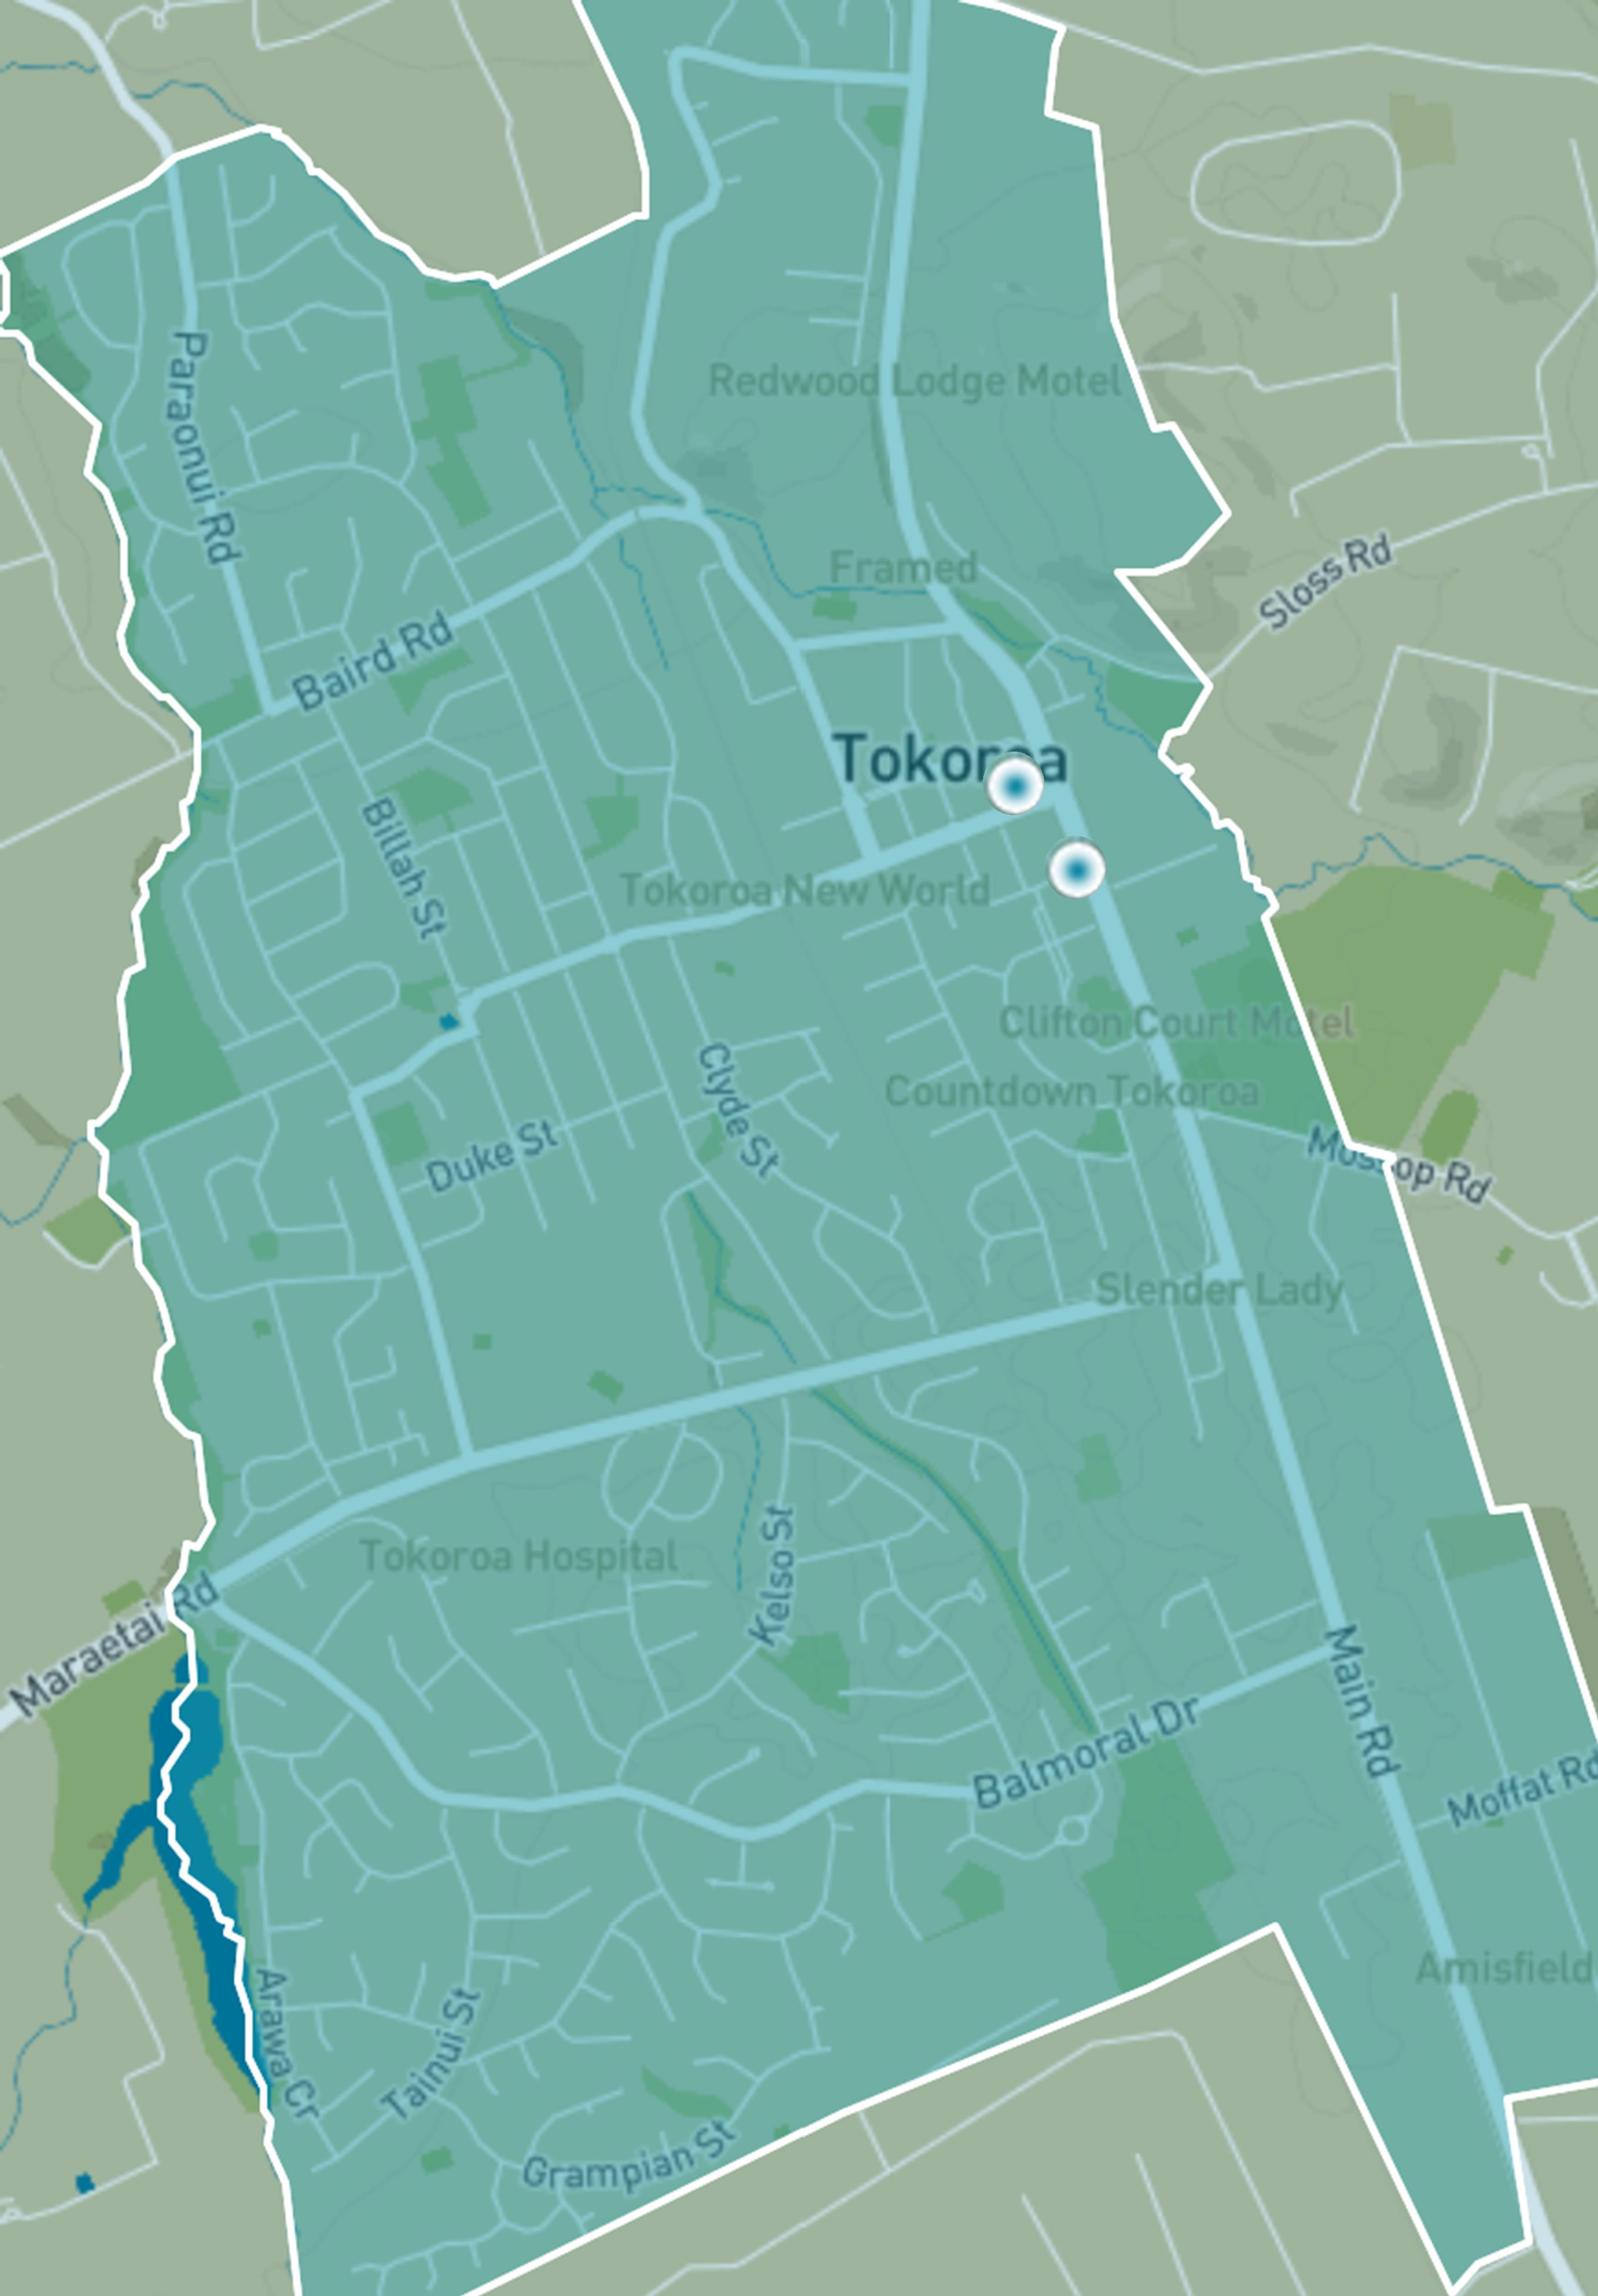
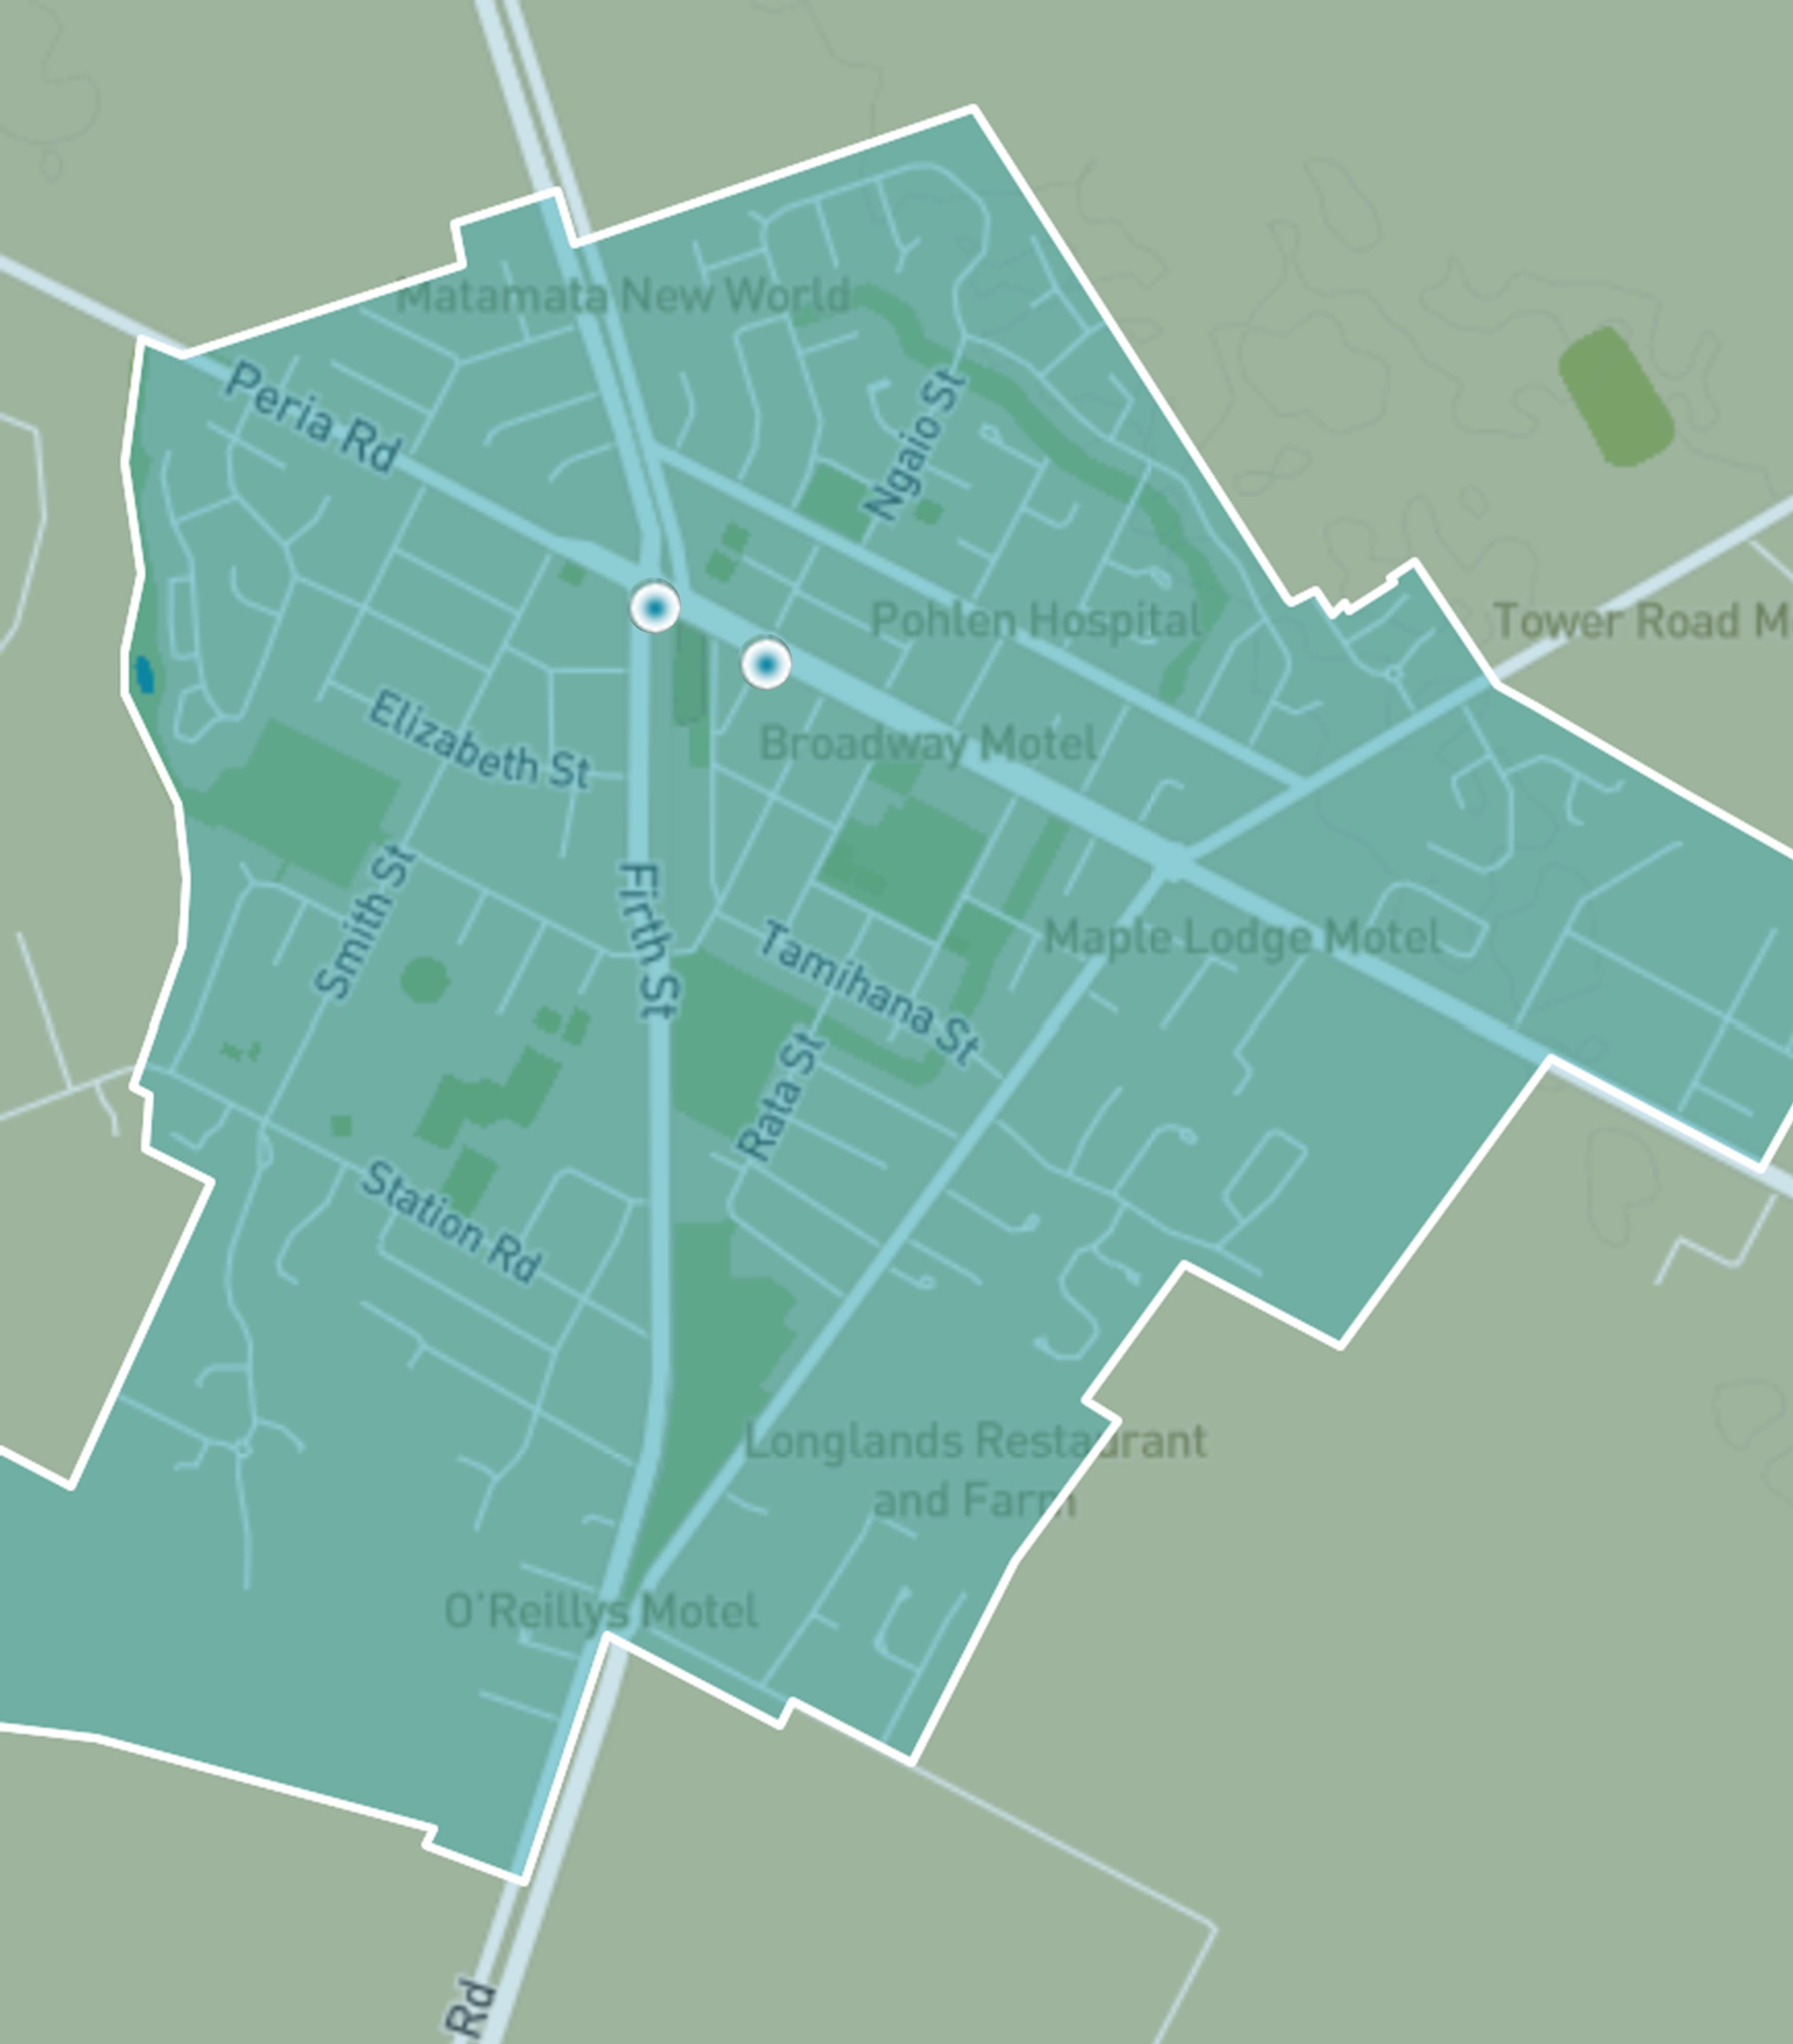
An additional six-month passive monitoring survey of NO2 was undertaken in Tokoroa and Matamata over the period December 2015 to June 2016. This monitoring survey (independent of NZTA’s programme) was managed by Watercare Services Ltd on behalf of Waikato Regional Council.
The Excel data file below contains the source data for this indicator's information.

Methods - how we monitor


More information
When this indicator is updated
This indicator is updated every year.
Last updated June 2023

To ask for help or report a problem, contact us
Tell us how we can improve the information on this page. (optional)