Pollutants in sediments
Why we monitor pollutants in sediments
This indicator monitors levels of trace elements and organic compounds in some of our region's estuarine sediments.
Estuaries are some of the most at-risk coastal ecosystems in the Waikato region. Many of the pressures affecting these coastal ecosystems are focused on inter-tidal sand and mud flats, which occupy significant areas of the region's estuaries. For example, 30 to 50 per cent of the area of eastern Coromandel estuaries consist of sand and mudflats.
Trace elements have both natural and man-made sources. Most of these elements are found in small amounts in the earth's crust. When volcanic rocks containing these elements are weathered and erode in the catchment, trace elements enter the marine sediments and naturally occur there. For example, in some areas of the Coromandel Peninsula, these elements are naturally enriched due to presence of sulphide mineralization.
Organic compounds are man-made persistent organic pollutants. Organochlorines are synthetic organic chemicals with chlorine in their structure. They have been used in pesticides, insecticides and fertilisers. Polycyclic aromatic hydrocarbons (PAHs) are released during combustion processes. They are sourced both naturally (from volcanoes) and from human activities, such as vehicle emissions (main source), home heating (mainly wood burning but also coal) and forest fires.
Mining, farming, urban and industrial activities can release trace elements and organic compounds into estuaries which may be stored in the sediments. The sediments then become a potential source of trace elements and organic compounds to animals and plants both in the sediment and the overlying water.
The natural release of trace elements and organic compounds from sediments depends upon the relative levels of the trace elements and organic compounds in the sediment and the water.
At low levels, various trace elements are not harmful and are even required by some living organisms. For example, many enzymes in the human body need and contain zinc and chromium to allow the body to process sugar, protein and fat.
Adverse (or toxic) effects can arise when levels of trace elements and organic compounds are too high. This can cause specific problems for animals and plants in estuaries, which may cause flow-on effects in humans.
Interim sediment quality guidelines (ISQGs) have been developed to show whether levels of these trace elements and organic compounds are elevated.
Results - data and trends
Waikato Regional Council has monitored the levels of trace elements and organic compounds in sediments of the inter-tidal sand and mudflats in seven estuaries: the Firth of Thames, Raglan (Whaingaroa) Harbour, Aotea Harbour, Kawhia Harbour, Port Waikato, Tairua Harbour and Whitianga Harbour.
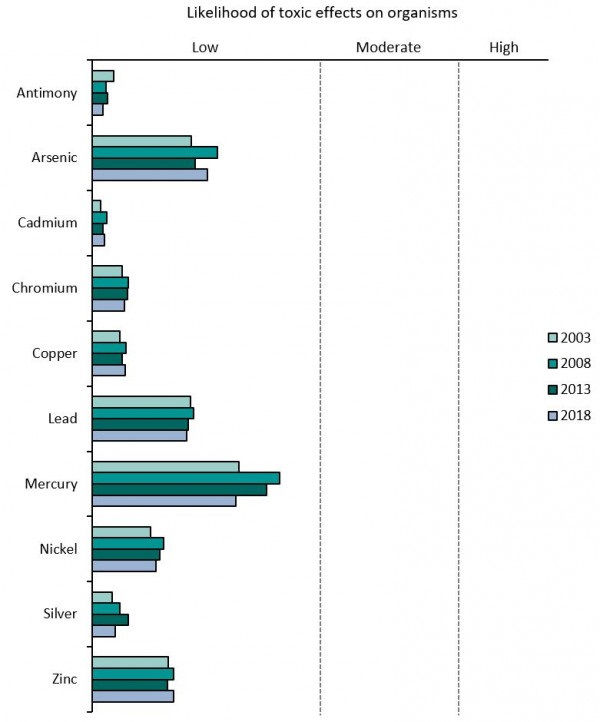
We commenced measuring pollutants in estuarine sediments in 2003, and have repeated the sampling at some sites every five to ten years.
Trace elements and organic compounds are known to accumulate slowly in sediments. For this reason we do not monitor estuaries at a regular frequency. Instead, the frequency of monitoring is determined by the risk of toxic effects on sediment-dwelling organisms revealed in the monitoring results as well as the risk of pollution from activities in the catchment.
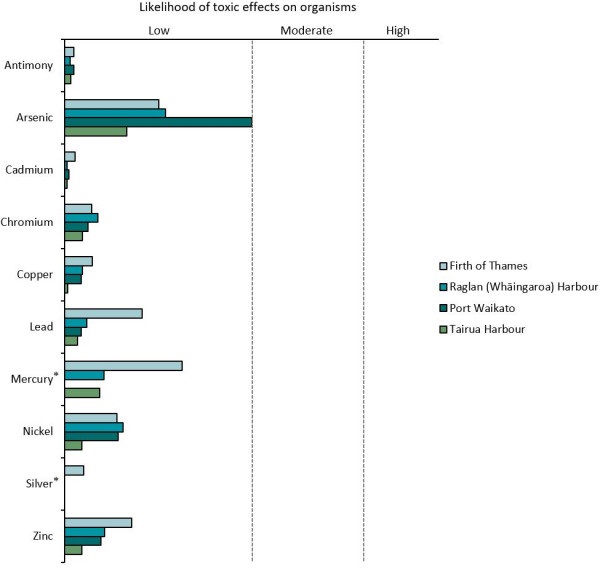
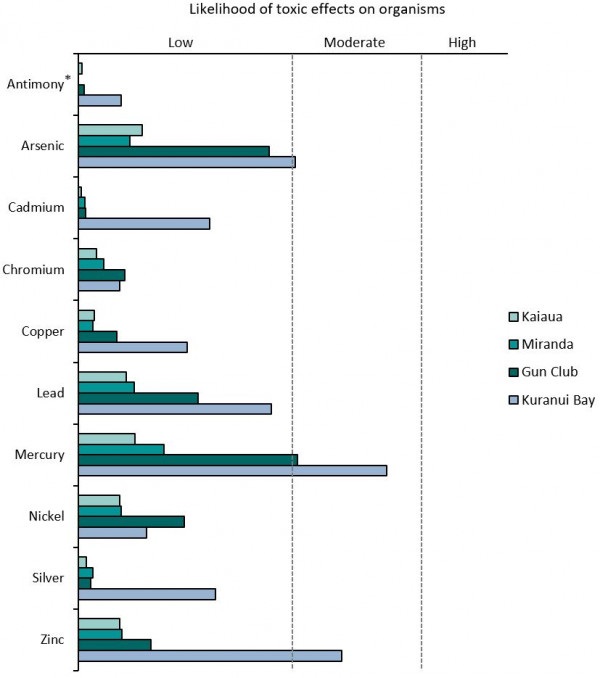
Sediment samples are analysed for a range of trace elements and organic compounds. Trace elements that we test for include antimony, arsenic, cadmium, chromium, copper, lead, mercury, nickel, silver, and zinc. Organic compounds include organochlorine pesticides (including DDT and dieldrin) and polycylic aromatic hydrocarbons (PAHs).
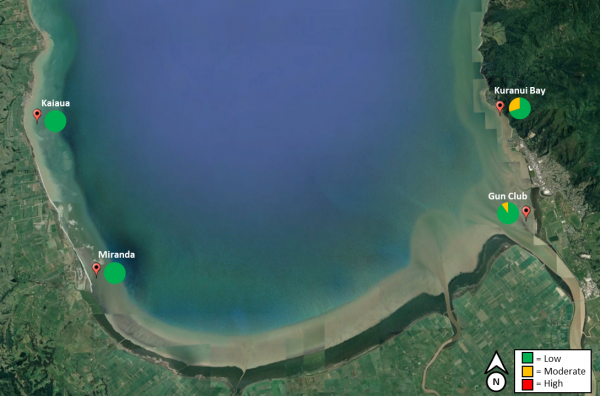
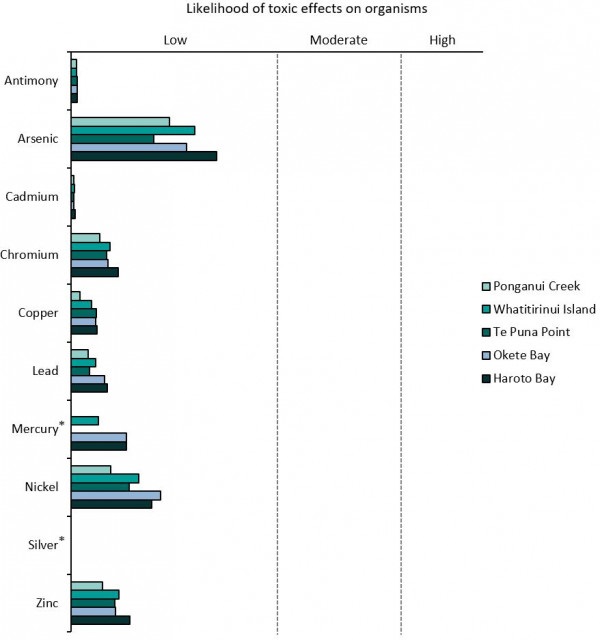
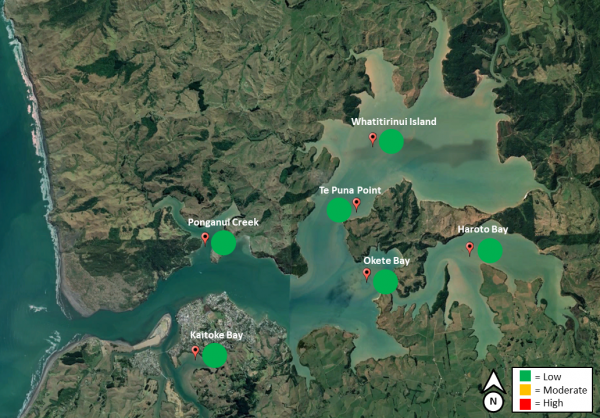
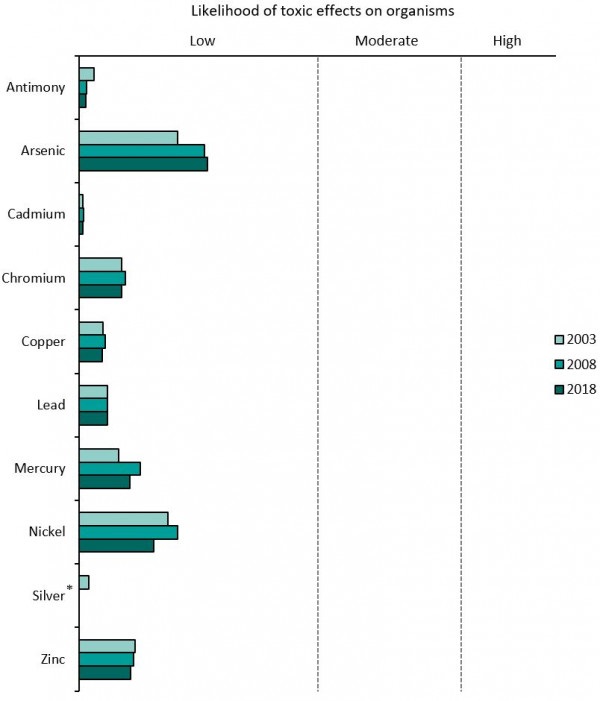
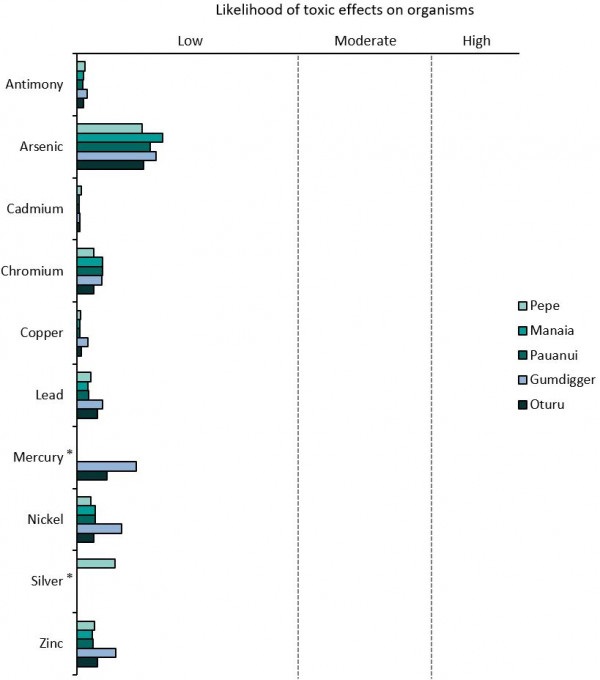
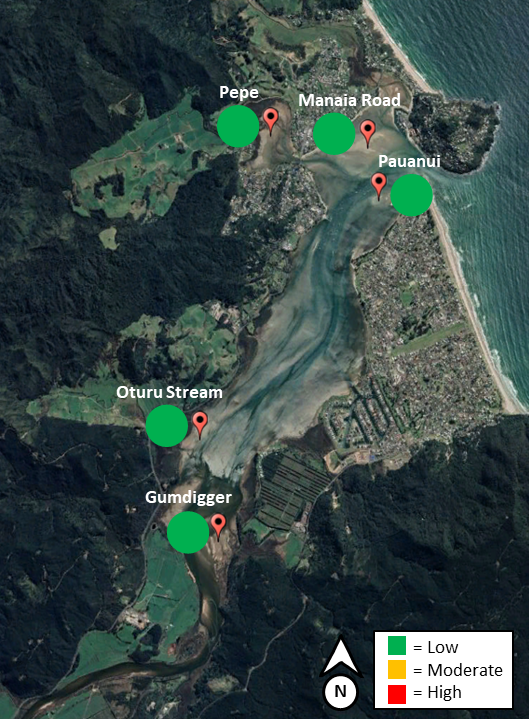
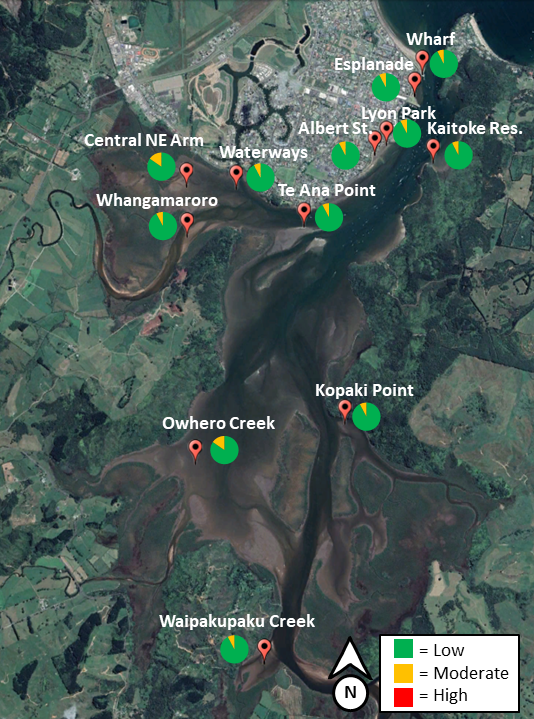
Our results have shown that the risk of toxic effects from trace elements on sediment-dwelling organisms is generally low in all sampled estuaries.
The Microsoft Excel file below contains the source data to this indicator's graphs and any additional data.
2003 to 2018
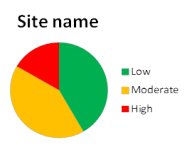
Sampling sites: locations and overall risk of toxic effects
Methods - how we monitor
More information
When this indicator is updated
This indicator is updated every ten years.
Last updated 18 June 2020



To ask for help or report a problem, contact us
Tell us how we can improve the information on this page. (optional)